|
2000
|
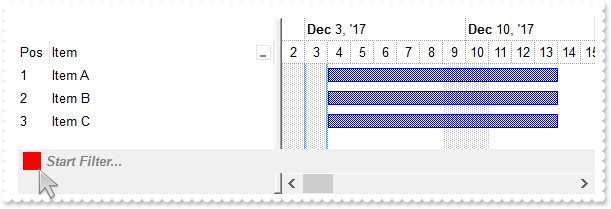
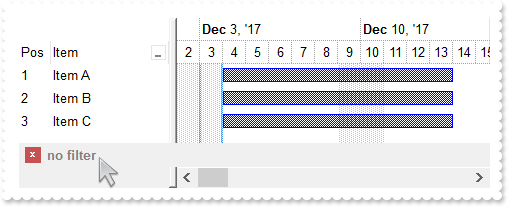
How can I change the visual appearance of the filter bar's close button (solid)
/*
with (this.EXG2ANTTCHARTACTIVEXCONTROL1.nativeObject)
	AddItem = class::nativeObject_AddItem
endwith
*/
// Occurs after a new Item has been inserted to Items collection.
function nativeObject_AddItem(Item)
	oG2antt = form.EXG2ANTTCHARTACTIVEXCONTROL1.nativeObject
	oG2antt.Items.AddBar(Item,"Task","12/04/2017","12/14/2017")
return

local oG2antt,var_Chart,var_Column,var_Column1,var_Items

oG2antt = form.EXG2ANTTCHARTACTIVEXCONTROL1.nativeObject
oG2antt.BeginUpdate()
var_Chart = oG2antt.Chart
	var_Chart.LevelCount = 2
	var_Chart.FirstVisibleDate = "12/02/2017"
	// var_Chart.PaneWidth(false) = 256
	with (oG2antt)
		TemplateDef = [dim var_Chart]
		TemplateDef = var_Chart
		Template = [var_Chart.PaneWidth(False) = 256]
	endwith
// oG2antt.Columns.Add("Item").DisplayFilterButton = true
var_Column = oG2antt.Columns.Add("Item")
with (oG2antt)
	TemplateDef = [dim var_Column]
	TemplateDef = var_Column
	Template = [var_Column.DisplayFilterButton = True]
endwith
var_Column1 = oG2antt.Columns.Add("Pos")
	var_Column1.AllowSizing = false
	var_Column1.AllowSort = false
	var_Column1.Width = 32
	var_Column1.FormatColumn = "1 apos ``"
	var_Column1.Position = 0
var_Items = oG2antt.Items
	var_Items.AddItem("Item A")
	var_Items.AddItem("Item B")
	var_Items.AddItem("Item C")
oG2antt.FilterBarPromptVisible = 1
oG2antt.Template = [Background(1) = 255] // oG2antt.Background(1) = 0xff
oG2antt.EndUpdate()
|
|
1999
|
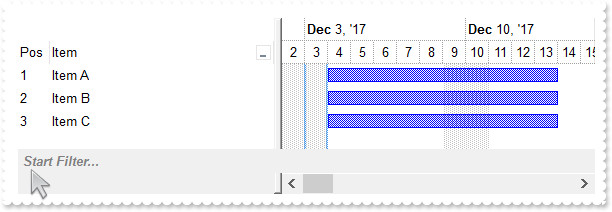
Is it possible to prevent definitely showing the filter bar's close button
/*
with (this.EXG2ANTTCHARTACTIVEXCONTROL1.nativeObject)
	AddItem = class::nativeObject_AddItem
endwith
*/
// Occurs after a new Item has been inserted to Items collection.
function nativeObject_AddItem(Item)
	oG2antt = form.EXG2ANTTCHARTACTIVEXCONTROL1.nativeObject
	oG2antt.Items.AddBar(Item,"Task","12/04/2017","12/14/2017")
return

local oG2antt,var_Chart,var_Column,var_Column1,var_Items

oG2antt = form.EXG2ANTTCHARTACTIVEXCONTROL1.nativeObject
oG2antt.BeginUpdate()
var_Chart = oG2antt.Chart
	var_Chart.LevelCount = 2
	var_Chart.FirstVisibleDate = "12/02/2017"
	// var_Chart.PaneWidth(false) = 256
	with (oG2antt)
		TemplateDef = [dim var_Chart]
		TemplateDef = var_Chart
		Template = [var_Chart.PaneWidth(False) = 256]
	endwith
// oG2antt.Columns.Add("Item").DisplayFilterButton = true
var_Column = oG2antt.Columns.Add("Item")
with (oG2antt)
	TemplateDef = [dim var_Column]
	TemplateDef = var_Column
	Template = [var_Column.DisplayFilterButton = True]
endwith
var_Column1 = oG2antt.Columns.Add("Pos")
	var_Column1.AllowSizing = false
	var_Column1.AllowSort = false
	var_Column1.Width = 32
	var_Column1.FormatColumn = "1 apos ``"
	var_Column1.Position = 0
var_Items = oG2antt.Items
	var_Items.AddItem("Item A")
	var_Items.AddItem("Item B")
	var_Items.AddItem("Item C")
oG2antt.FilterBarPromptVisible = 1
oG2antt.Template = [Background(1) = -1] // oG2antt.Background(1) = -1
oG2antt.EndUpdate()
|
|
1998
|
Is it possible to show the close button only if there is a filter applied

/*
with (this.EXG2ANTTCHARTACTIVEXCONTROL1.nativeObject)
	AddItem = class::nativeObject_AddItem
endwith
*/
// Occurs after a new Item has been inserted to Items collection.
function nativeObject_AddItem(Item)
	oG2antt = form.EXG2ANTTCHARTACTIVEXCONTROL1.nativeObject
	oG2antt.Items.AddBar(Item,"Task","12/04/2017","12/14/2017")
return

local oG2antt,var_Chart,var_Column,var_Column1,var_Items

oG2antt = form.EXG2ANTTCHARTACTIVEXCONTROL1.nativeObject
oG2antt.BeginUpdate()
var_Chart = oG2antt.Chart
	var_Chart.LevelCount = 2
	var_Chart.FirstVisibleDate = "12/02/2017"
	// var_Chart.PaneWidth(false) = 256
	with (oG2antt)
		TemplateDef = [dim var_Chart]
		TemplateDef = var_Chart
		Template = [var_Chart.PaneWidth(False) = 256]
	endwith
// oG2antt.Columns.Add("Item").DisplayFilterButton = true
var_Column = oG2antt.Columns.Add("Item")
with (oG2antt)
	TemplateDef = [dim var_Column]
	TemplateDef = var_Column
	Template = [var_Column.DisplayFilterButton = True]
endwith
var_Column1 = oG2antt.Columns.Add("Pos")
	var_Column1.AllowSizing = false
	var_Column1.AllowSort = false
	var_Column1.Width = 32
	var_Column1.FormatColumn = "1 apos ``"
	var_Column1.Position = 0
var_Items = oG2antt.Items
	var_Items.AddItem("Item A")
	var_Items.AddItem("Item B")
	var_Items.AddItem("Item C")
oG2antt.FilterBarPromptVisible = 513 /*exFilterBarShowCloseIfRequired | exFilterBarPromptVisible*/
oG2antt.EndUpdate()
|
|
1997
|
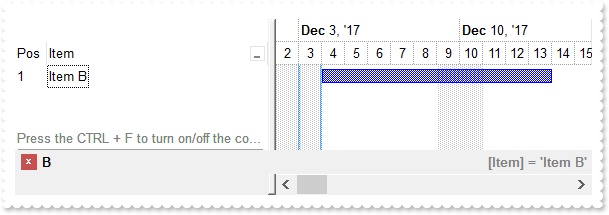
The control's filter bar is not closed once I click the close button (toggle)
/*
with (this.EXG2ANTTCHARTACTIVEXCONTROL1.nativeObject)
	AddItem = class::nativeObject_AddItem
endwith
*/
// Occurs after a new Item has been inserted to Items collection.
function nativeObject_AddItem(Item)
	oG2antt = form.EXG2ANTTCHARTACTIVEXCONTROL1.nativeObject
	oG2antt.Items.AddBar(Item,"Task","12/04/2017","12/14/2017")
return

local h,oG2antt,var_Chart,var_Column,var_Column1,var_Column2,var_Items

oG2antt = form.EXG2ANTTCHARTACTIVEXCONTROL1.nativeObject
oG2antt.BeginUpdate()
var_Chart = oG2antt.Chart
	var_Chart.LevelCount = 2
	var_Chart.FirstVisibleDate = "12/02/2017"
	// var_Chart.PaneWidth(false) = 256
	with (oG2antt)
		TemplateDef = [dim var_Chart]
		TemplateDef = var_Chart
		Template = [var_Chart.PaneWidth(False) = 256]
	endwith
// oG2antt.Columns.Add("Item").DisplayFilterButton = true
var_Column = oG2antt.Columns.Add("Item")
with (oG2antt)
	TemplateDef = [dim var_Column]
	TemplateDef = var_Column
	Template = [var_Column.DisplayFilterButton = True]
endwith
var_Column1 = oG2antt.Columns.Add("Pos")
	var_Column1.AllowSizing = false
	var_Column1.AllowSort = false
	var_Column1.Width = 32
	var_Column1.FormatColumn = "1 apos ``"
	var_Column1.Position = 0
var_Items = oG2antt.Items
	var_Items.AddItem("Item A")
	var_Items.AddItem("Item B")
	var_Items.AddItem("Item C")
	// var_Items.LockedItemCount(2) = 1
	with (oG2antt)
		TemplateDef = [dim var_Items]
		TemplateDef = var_Items
		Template = [var_Items.LockedItemCount(2) = 1]
	endwith
	h = var_Items.LockedItem(2,0)
	// var_Items.ItemDivider(h) = 0
	with (oG2antt)
		TemplateDef = [dim var_Items,h]
		TemplateDef = var_Items
		TemplateDef = h
		Template = [var_Items.ItemDivider(h) = 0]
	endwith
	// var_Items.CellValue(h,0) = "<c><fgcolor=808080>Press the CTRL + F to turn on/off the control's filter bar. ALT + Up/Down moves the focus."
	with (oG2antt)
		TemplateDef = [dim var_Items,h]
		TemplateDef = var_Items
		TemplateDef = h
		Template = [var_Items.CellValue(h,0) = "<c><fgcolor=808080>Press the CTRL + F to turn on/off the control's filter bar. ALT + Up/Down moves the focus."]
	endwith
	// var_Items.CellValueFormat(h,0) = 1
	with (oG2antt)
		TemplateDef = [dim var_Items,h]
		TemplateDef = var_Items
		TemplateDef = h
		Template = [var_Items.CellValueFormat(h,0) = 1]
	endwith
oG2antt.FilterBarCaption = "`<r><fgcolor=808080>` + value"
oG2antt.FilterBarPromptPattern = "B"
oG2antt.FilterBarPromptVisible = 2323 /*exFilterBarCompact | exFilterBarToggle | exFilterBarSingleLine | exFilterBarVisible | exFilterBarPromptVisible*/
var_Column2 = oG2antt.Columns.Item(0)
	var_Column2.FilterType = 240
	var_Column2.Filter = "Item B"
oG2antt.ApplyFilter()
oG2antt.EndUpdate()
|
|
1996
|
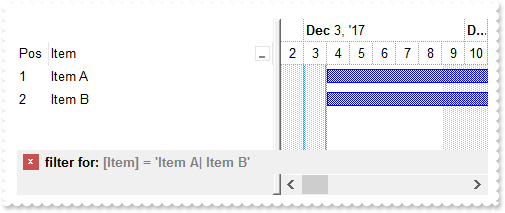
How can I display the control's filter on a single line
/*
with (this.EXG2ANTTCHARTACTIVEXCONTROL1.nativeObject)
	AddItem = class::nativeObject_AddItem
endwith
*/
// Occurs after a new Item has been inserted to Items collection.
function nativeObject_AddItem(Item)
	oG2antt = form.EXG2ANTTCHARTACTIVEXCONTROL1.nativeObject
	oG2antt.Items.AddBar(Item,"Task","12/04/2017","12/14/2017")
return

local oG2antt,var_Chart,var_Column,var_Column1,var_Column2,var_Items

oG2antt = form.EXG2ANTTCHARTACTIVEXCONTROL1.nativeObject
oG2antt.BeginUpdate()
var_Chart = oG2antt.Chart
	var_Chart.LevelCount = 2
	var_Chart.FirstVisibleDate = "12/02/2017"
	// var_Chart.PaneWidth(false) = 256
	with (oG2antt)
		TemplateDef = [dim var_Chart]
		TemplateDef = var_Chart
		Template = [var_Chart.PaneWidth(False) = 256]
	endwith
// oG2antt.Columns.Add("Item").DisplayFilterButton = true
var_Column = oG2antt.Columns.Add("Item")
with (oG2antt)
	TemplateDef = [dim var_Column]
	TemplateDef = var_Column
	Template = [var_Column.DisplayFilterButton = True]
endwith
var_Column1 = oG2antt.Columns.Add("Pos")
	var_Column1.AllowSizing = false
	var_Column1.AllowSort = false
	var_Column1.Width = 32
	var_Column1.FormatColumn = "1 apos ``"
	var_Column1.Position = 0
var_Items = oG2antt.Items
	var_Items.AddItem("Item A")
	var_Items.AddItem("Item B")
	var_Items.AddItem("Item C")
oG2antt.FilterBarCaption = "len(value) ? `filter for: <fgcolor 808080>` + value  : `<fgcolor 808080>no filter`"
oG2antt.FilterBarPromptVisible = 18 /*exFilterBarSingleLine | exFilterBarVisible*/
var_Column2 = oG2antt.Columns.Item(0)
	var_Column2.FilterType = 240
	var_Column2.Filter = "Item A|Item B"
oG2antt.ApplyFilter()
oG2antt.EndUpdate()
|
|
1995
|
How can I display the control's filter on a single line (prompt-combined)
/*
with (this.EXG2ANTTCHARTACTIVEXCONTROL1.nativeObject)
	AddItem = class::nativeObject_AddItem
endwith
*/
// Occurs after a new Item has been inserted to Items collection.
function nativeObject_AddItem(Item)
	oG2antt = form.EXG2ANTTCHARTACTIVEXCONTROL1.nativeObject
	oG2antt.Items.AddBar(Item,"Task","12/04/2017","12/14/2017")
return

local oG2antt,var_Chart,var_Column,var_Column1,var_Column2,var_Items

oG2antt = form.EXG2ANTTCHARTACTIVEXCONTROL1.nativeObject
oG2antt.BeginUpdate()
var_Chart = oG2antt.Chart
	var_Chart.LevelCount = 2
	var_Chart.FirstVisibleDate = "12/02/2017"
	// var_Chart.PaneWidth(false) = 256
	with (oG2antt)
		TemplateDef = [dim var_Chart]
		TemplateDef = var_Chart
		Template = [var_Chart.PaneWidth(False) = 256]
	endwith
// oG2antt.Columns.Add("Item").DisplayFilterButton = true
var_Column = oG2antt.Columns.Add("Item")
with (oG2antt)
	TemplateDef = [dim var_Column]
	TemplateDef = var_Column
	Template = [var_Column.DisplayFilterButton = True]
endwith
var_Column1 = oG2antt.Columns.Add("Pos")
	var_Column1.AllowSizing = false
	var_Column1.AllowSort = false
	var_Column1.Width = 32
	var_Column1.FormatColumn = "1 apos ``"
	var_Column1.Position = 0
var_Items = oG2antt.Items
	var_Items.AddItem("Item A")
	var_Items.AddItem("Item B")
	var_Items.AddItem("Item C")
oG2antt.FilterBarCaption = "`<r>` + value"
oG2antt.FilterBarPromptVisible = 2067 /*exFilterBarCompact | exFilterBarSingleLine | exFilterBarVisible | exFilterBarPromptVisible*/
var_Column2 = oG2antt.Columns.Item(0)
	var_Column2.FilterType = 240
	var_Column2.Filter = "Item A|Item B"
oG2antt.ApplyFilter()
oG2antt.EndUpdate()
|
|
1994
|
How can I get the number of results after a filter is applied
/*
with (this.EXG2ANTTCHARTACTIVEXCONTROL1.nativeObject)
	AddItem = class::nativeObject_AddItem
endwith
*/
// Occurs after a new Item has been inserted to Items collection.
function nativeObject_AddItem(Item)
	oG2antt = form.EXG2ANTTCHARTACTIVEXCONTROL1.nativeObject
	oG2antt.Items.AddBar(Item,"Task","12/04/2017","12/14/2017")
return

/*
with (this.EXG2ANTTCHARTACTIVEXCONTROL1.nativeObject)
	Click = class::nativeObject_Click
endwith
*/
// Occurs when the user presses and then releases the left mouse button over the tree control.
function nativeObject_Click()
	oG2antt = form.EXG2ANTTCHARTACTIVEXCONTROL1.nativeObject
	oG2antt.ClearFilter()
return

/*
with (this.EXG2ANTTCHARTACTIVEXCONTROL1.nativeObject)
	FilterChange = class::nativeObject_FilterChange
endwith
*/
// Occurs when the filter was changed.
function nativeObject_FilterChange()
	oG2antt = form.EXG2ANTTCHARTACTIVEXCONTROL1.nativeObject
	? "Items.MatchItemCount"
	? Str(oG2antt.Items.MatchItemCount)
	? Str(oG2antt.FormatABC("value < 0 ? `filter applied: ` + abs(value + 1) + ` result(s)` : `no filter`",oG2antt.Items.MatchItemCount))
return

local oG2antt,var_Chart,var_Column,var_Column1,var_Items

oG2antt = form.EXG2ANTTCHARTACTIVEXCONTROL1.nativeObject
oG2antt.BeginUpdate()
var_Chart = oG2antt.Chart
	var_Chart.LevelCount = 2
	var_Chart.FirstVisibleDate = "12/02/2017"
	// var_Chart.PaneWidth(false) = 256
	with (oG2antt)
		TemplateDef = [dim var_Chart]
		TemplateDef = var_Chart
		Template = [var_Chart.PaneWidth(False) = 256]
	endwith
// oG2antt.Columns.Add("Item").DisplayFilterButton = true
var_Column = oG2antt.Columns.Add("Item")
with (oG2antt)
	TemplateDef = [dim var_Column]
	TemplateDef = var_Column
	Template = [var_Column.DisplayFilterButton = True]
endwith
var_Column1 = oG2antt.Columns.Add("Pos")
	var_Column1.AllowSizing = false
	var_Column1.AllowSort = false
	var_Column1.Width = 32
	var_Column1.FormatColumn = "1 apos ``"
	var_Column1.Position = 0
var_Items = oG2antt.Items
	var_Items.AddItem("Item A")
	var_Items.AddItem("Item B")
	var_Items.AddItem("Item C")
oG2antt.FilterBarPromptVisible = 1
oG2antt.FilterBarPromptPattern = "Item"
oG2antt.EndUpdate()
|
|
1993
|
How can I programmatically clear the control's filter
/*
with (this.EXG2ANTTCHARTACTIVEXCONTROL1.nativeObject)
	AddItem = class::nativeObject_AddItem
endwith
*/
// Occurs after a new Item has been inserted to Items collection.
function nativeObject_AddItem(Item)
	oG2antt = form.EXG2ANTTCHARTACTIVEXCONTROL1.nativeObject
	oG2antt.Items.AddBar(Item,"Task","12/04/2017","12/14/2017")
return

/*
with (this.EXG2ANTTCHARTACTIVEXCONTROL1.nativeObject)
	Click = class::nativeObject_Click
endwith
*/
// Occurs when the user presses and then releases the left mouse button over the tree control.
function nativeObject_Click()
	oG2antt = form.EXG2ANTTCHARTACTIVEXCONTROL1.nativeObject
	oG2antt.ClearFilter()
return

local oG2antt,var_Chart,var_Column,var_Column1,var_Items

oG2antt = form.EXG2ANTTCHARTACTIVEXCONTROL1.nativeObject
oG2antt.BeginUpdate()
var_Chart = oG2antt.Chart
	var_Chart.LevelCount = 2
	var_Chart.FirstVisibleDate = "12/02/2017"
	// var_Chart.PaneWidth(false) = 256
	with (oG2antt)
		TemplateDef = [dim var_Chart]
		TemplateDef = var_Chart
		Template = [var_Chart.PaneWidth(False) = 256]
	endwith
// oG2antt.Columns.Add("Item").DisplayFilterButton = true
var_Column = oG2antt.Columns.Add("Item")
with (oG2antt)
	TemplateDef = [dim var_Column]
	TemplateDef = var_Column
	Template = [var_Column.DisplayFilterButton = True]
endwith
var_Column1 = oG2antt.Columns.Add("Pos")
	var_Column1.AllowSizing = false
	var_Column1.AllowSort = false
	var_Column1.Width = 32
	var_Column1.FormatColumn = "1 apos ``"
	var_Column1.Position = 0
var_Items = oG2antt.Items
	var_Items.AddItem("Item A")
	var_Items.AddItem("Item B")
	var_Items.AddItem("Item C")
oG2antt.FilterBarPromptVisible = 1
oG2antt.FilterBarPromptPattern = "B"
oG2antt.EndUpdate()
|
|
1992
|
Is it possible to prevent closing the control's filter bar, so it is always shown (prompt-combined)
/*
with (this.EXG2ANTTCHARTACTIVEXCONTROL1.nativeObject)
	AddItem = class::nativeObject_AddItem
endwith
*/
// Occurs after a new Item has been inserted to Items collection.
function nativeObject_AddItem(Item)
	oG2antt = form.EXG2ANTTCHARTACTIVEXCONTROL1.nativeObject
	oG2antt.Items.AddBar(Item,"Task","12/04/2017","12/14/2017")
return

local oG2antt,var_Chart,var_Column,var_Column1,var_Column2,var_Items

oG2antt = form.EXG2ANTTCHARTACTIVEXCONTROL1.nativeObject
oG2antt.BeginUpdate()
var_Chart = oG2antt.Chart
	var_Chart.LevelCount = 2
	var_Chart.FirstVisibleDate = "12/02/2017"
	// var_Chart.PaneWidth(false) = 256
	with (oG2antt)
		TemplateDef = [dim var_Chart]
		TemplateDef = var_Chart
		Template = [var_Chart.PaneWidth(False) = 256]
	endwith
// oG2antt.Columns.Add("Item").DisplayFilterButton = true
var_Column = oG2antt.Columns.Add("Item")
with (oG2antt)
	TemplateDef = [dim var_Column]
	TemplateDef = var_Column
	Template = [var_Column.DisplayFilterButton = True]
endwith
var_Column1 = oG2antt.Columns.Add("Pos")
	var_Column1.AllowSizing = false
	var_Column1.AllowSort = false
	var_Column1.Width = 32
	var_Column1.FormatColumn = "1 apos ``"
	var_Column1.Position = 0
var_Items = oG2antt.Items
	var_Items.AddItem("Item A")
	var_Items.AddItem("Item B")
	var_Items.AddItem("Item C")
oG2antt.FilterBarPromptPattern = "B"
oG2antt.FilterBarPromptVisible = 3 /*exFilterBarVisible | exFilterBarPromptVisible*/
var_Column2 = oG2antt.Columns.Item(0)
	var_Column2.FilterType = 240
	var_Column2.Filter = "Item B"
oG2antt.ApplyFilter()
oG2antt.EndUpdate()
|
|
1991
|
Is it possible to prevent closing the control's filter bar, so it is always shown (prompt)
/*
with (this.EXG2ANTTCHARTACTIVEXCONTROL1.nativeObject)
	AddItem = class::nativeObject_AddItem
endwith
*/
// Occurs after a new Item has been inserted to Items collection.
function nativeObject_AddItem(Item)
	oG2antt = form.EXG2ANTTCHARTACTIVEXCONTROL1.nativeObject
	oG2antt.Items.AddBar(Item,"Task","12/04/2017","12/14/2017")
return

local oG2antt,var_Chart,var_Column,var_Column1,var_Items

oG2antt = form.EXG2ANTTCHARTACTIVEXCONTROL1.nativeObject
oG2antt.BeginUpdate()
var_Chart = oG2antt.Chart
	var_Chart.LevelCount = 2
	var_Chart.FirstVisibleDate = "12/02/2017"
	// var_Chart.PaneWidth(false) = 256
	with (oG2antt)
		TemplateDef = [dim var_Chart]
		TemplateDef = var_Chart
		Template = [var_Chart.PaneWidth(False) = 256]
	endwith
// oG2antt.Columns.Add("Item").DisplayFilterButton = true
var_Column = oG2antt.Columns.Add("Item")
with (oG2antt)
	TemplateDef = [dim var_Column]
	TemplateDef = var_Column
	Template = [var_Column.DisplayFilterButton = True]
endwith
var_Column1 = oG2antt.Columns.Add("Pos")
	var_Column1.AllowSizing = false
	var_Column1.AllowSort = false
	var_Column1.Width = 32
	var_Column1.FormatColumn = "1 apos ``"
	var_Column1.Position = 0
var_Items = oG2antt.Items
	var_Items.AddItem("Item A")
	var_Items.AddItem("Item B")
	var_Items.AddItem("Item C")
oG2antt.FilterBarPromptVisible = 1
oG2antt.FilterBarPromptPattern = "B"
oG2antt.EndUpdate()
|
|
1990
|
Is it possible to prevent closing the control's filter bar, so it is always shown
/*
with (this.EXG2ANTTCHARTACTIVEXCONTROL1.nativeObject)
	AddItem = class::nativeObject_AddItem
endwith
*/
// Occurs after a new Item has been inserted to Items collection.
function nativeObject_AddItem(Item)
	oG2antt = form.EXG2ANTTCHARTACTIVEXCONTROL1.nativeObject
	oG2antt.Items.AddBar(Item,"Task","12/04/2017","12/14/2017")
return

local oG2antt,var_Chart,var_Column,var_Column1,var_Column2,var_Items

oG2antt = form.EXG2ANTTCHARTACTIVEXCONTROL1.nativeObject
oG2antt.BeginUpdate()
var_Chart = oG2antt.Chart
	var_Chart.LevelCount = 2
	var_Chart.FirstVisibleDate = "12/02/2017"
	// var_Chart.PaneWidth(false) = 256
	with (oG2antt)
		TemplateDef = [dim var_Chart]
		TemplateDef = var_Chart
		Template = [var_Chart.PaneWidth(False) = 256]
	endwith
// oG2antt.Columns.Add("Item").DisplayFilterButton = true
var_Column = oG2antt.Columns.Add("Item")
with (oG2antt)
	TemplateDef = [dim var_Column]
	TemplateDef = var_Column
	Template = [var_Column.DisplayFilterButton = True]
endwith
var_Column1 = oG2antt.Columns.Add("Pos")
	var_Column1.AllowSizing = false
	var_Column1.AllowSort = false
	var_Column1.Width = 32
	var_Column1.FormatColumn = "1 apos ``"
	var_Column1.Position = 0
var_Items = oG2antt.Items
	var_Items.AddItem("Item A")
	var_Items.AddItem("Item B")
	var_Items.AddItem("Item C")
oG2antt.FilterBarCaption = "len(value) = 0 ? `<fgcolor=808080>no filter` : value"
oG2antt.FilterBarPromptVisible = 2
var_Column2 = oG2antt.Columns.Item(0)
	var_Column2.FilterType = 240
	var_Column2.Filter = "Item B"
oG2antt.ApplyFilter()
oG2antt.EndUpdate()
|
|
1989
|
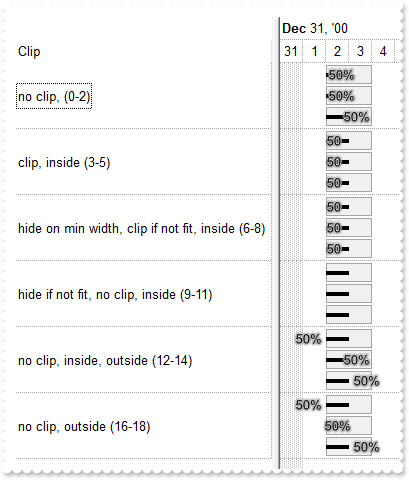
What are the options to align the percent caption
local h,oG2antt,var_Bar,var_Chart,var_Items

oG2antt = form.EXG2ANTTCHARTACTIVEXCONTROL1.nativeObject
oG2antt.BeginUpdate()
oG2antt.Columns.Add("Clip")
oG2antt.ScrollBySingleLine = true
oG2antt.DrawGridLines = -2
var_Chart = oG2antt.Chart
	var_Chart.AllowResizeChart = 6 /*exAllowResizeChartMiddle | exAllowResizeChartHeader*/
	var_Chart.DrawGridLines = -2
	var_Chart.FirstVisibleDate = "12/26/2000"
	var_Chart.LevelCount = 2
	// var_Chart.PaneWidth(false) = 256
	with (oG2antt)
		TemplateDef = [dim var_Chart]
		TemplateDef = var_Chart
		Template = [var_Chart.PaneWidth(False) = 256]
	endwith
	var_Bar = var_Chart.Bars.Add("Task%Progress")
		var_Bar.Shortcut = "Task"
		var_Bar.Pattern = 32
		var_Bar.Color = 0xa4a4a4
		var_Bar.StartColor = 0xf0f0f0
		var_Bar.EndColor = var_Bar.StartColor
		var_Bar.OverlaidType = 4611 /*exOverlaidBarsIncludeCaption | exOverlaidBarsStackAutoArrange | exOverlaidBarsStack*/
		var_Bar.Height = 15
		// var_Bar.Def(12) = 0.5
		with (oG2antt)
			TemplateDef = [dim var_Bar]
			TemplateDef = var_Bar
			Template = [var_Bar.Def(12) = 0.5]
		endwith
		// var_Bar.Def(14) = true
		with (oG2antt)
			TemplateDef = [dim var_Bar]
			TemplateDef = var_Bar
			Template = [var_Bar.Def(14) = True]
		endwith
		// var_Bar.Def(13) = "<sha ;;0>%p%"
		with (oG2antt)
			TemplateDef = [dim var_Bar]
			TemplateDef = var_Bar
			Template = [var_Bar.Def(13) = "<sha ;;0>%p%"]
		endwith
var_Items = oG2antt.Items
	h = var_Items.AddItem("no clip, (0-2)")
	var_Items.AddBar(h,"Task","01/02/2001","01/04/2001","K1")
	// var_Items.ItemBar(h,"K1",15) = 2
	with (oG2antt)
		TemplateDef = [dim var_Items,h]
		TemplateDef = var_Items
		TemplateDef = h
		Template = [var_Items.ItemBar(h,"K1",15) = 2]
	endwith
	var_Items.AddBar(h,"Task","01/02/2001","01/04/2001","K2")
	// var_Items.ItemBar(h,"K2",15) = 1
	with (oG2antt)
		TemplateDef = [dim var_Items,h]
		TemplateDef = var_Items
		TemplateDef = h
		Template = [var_Items.ItemBar(h,"K2",15) = 1]
	endwith
	var_Items.AddBar(h,"Task","01/02/2001","01/04/2001","K3")
	// var_Items.ItemBar(h,"K3",15) = 0
	with (oG2antt)
		TemplateDef = [dim var_Items,h]
		TemplateDef = var_Items
		TemplateDef = h
		Template = [var_Items.ItemBar(h,"K3",15) = 0]
	endwith
	h = var_Items.AddItem("clip, inside (3-5)")
	var_Items.AddBar(h,"Task","01/02/2001","01/04/2001","K1")
	// var_Items.ItemBar(h,"K1",15) = 5
	with (oG2antt)
		TemplateDef = [dim var_Items,h]
		TemplateDef = var_Items
		TemplateDef = h
		Template = [var_Items.ItemBar(h,"K1",15) = 5]
	endwith
	var_Items.AddBar(h,"Task","01/02/2001","01/04/2001","K2")
	// var_Items.ItemBar(h,"K2",15) = 4
	with (oG2antt)
		TemplateDef = [dim var_Items,h]
		TemplateDef = var_Items
		TemplateDef = h
		Template = [var_Items.ItemBar(h,"K2",15) = 4]
	endwith
	var_Items.AddBar(h,"Task","01/02/2001","01/04/2001","K3")
	// var_Items.ItemBar(h,"K3",15) = 3
	with (oG2antt)
		TemplateDef = [dim var_Items,h]
		TemplateDef = var_Items
		TemplateDef = h
		Template = [var_Items.ItemBar(h,"K3",15) = 3]
	endwith
	h = var_Items.AddItem("hide on min width, clip if not fit, inside (6-8)")
	var_Items.AddBar(h,"Task","01/02/2001","01/04/2001","K1")
	// var_Items.ItemBar(h,"K1",15) = 8
	with (oG2antt)
		TemplateDef = [dim var_Items,h]
		TemplateDef = var_Items
		TemplateDef = h
		Template = [var_Items.ItemBar(h,"K1",15) = 8]
	endwith
	var_Items.AddBar(h,"Task","01/02/2001","01/04/2001","K2")
	// var_Items.ItemBar(h,"K2",15) = 7
	with (oG2antt)
		TemplateDef = [dim var_Items,h]
		TemplateDef = var_Items
		TemplateDef = h
		Template = [var_Items.ItemBar(h,"K2",15) = 7]
	endwith
	var_Items.AddBar(h,"Task","01/02/2001","01/04/2001","K3")
	// var_Items.ItemBar(h,"K3",15) = 6
	with (oG2antt)
		TemplateDef = [dim var_Items,h]
		TemplateDef = var_Items
		TemplateDef = h
		Template = [var_Items.ItemBar(h,"K3",15) = 6]
	endwith
	h = var_Items.AddItem("hide if not fit, no clip, inside (9-11)")
	var_Items.AddBar(h,"Task","01/02/2001","01/04/2001","K1")
	// var_Items.ItemBar(h,"K1",15) = 11
	with (oG2antt)
		TemplateDef = [dim var_Items,h]
		TemplateDef = var_Items
		TemplateDef = h
		Template = [var_Items.ItemBar(h,"K1",15) = 11]
	endwith
	var_Items.AddBar(h,"Task","01/02/2001","01/04/2001","K2")
	// var_Items.ItemBar(h,"K2",15) = 10
	with (oG2antt)
		TemplateDef = [dim var_Items,h]
		TemplateDef = var_Items
		TemplateDef = h
		Template = [var_Items.ItemBar(h,"K2",15) = 10]
	endwith
	var_Items.AddBar(h,"Task","01/02/2001","01/04/2001","K3")
	// var_Items.ItemBar(h,"K3",15) = 9
	with (oG2antt)
		TemplateDef = [dim var_Items,h]
		TemplateDef = var_Items
		TemplateDef = h
		Template = [var_Items.ItemBar(h,"K3",15) = 9]
	endwith
	h = var_Items.AddItem("no clip, inside, outside (12-14)")
	var_Items.AddBar(h,"Task","01/02/2001","01/04/2001","K1")
	// var_Items.ItemBar(h,"K1",15) = 14
	with (oG2antt)
		TemplateDef = [dim var_Items,h]
		TemplateDef = var_Items
		TemplateDef = h
		Template = [var_Items.ItemBar(h,"K1",15) = 14]
	endwith
	var_Items.AddBar(h,"Task","01/02/2001","01/04/2001","K2")
	// var_Items.ItemBar(h,"K2",4) = 13
	with (oG2antt)
		TemplateDef = [dim var_Items,h]
		TemplateDef = var_Items
		TemplateDef = h
		Template = [var_Items.ItemBar(h,"K2",4) = 13]
	endwith
	var_Items.AddBar(h,"Task","01/02/2001","01/04/2001","K3")
	// var_Items.ItemBar(h,"K3",15) = 12
	with (oG2antt)
		TemplateDef = [dim var_Items,h]
		TemplateDef = var_Items
		TemplateDef = h
		Template = [var_Items.ItemBar(h,"K3",15) = 12]
	endwith
	h = var_Items.AddItem("no clip, outside (16-18)")
	var_Items.AddBar(h,"Task","01/02/2001","01/04/2001","K1")
	// var_Items.ItemBar(h,"K1",15) = 18
	with (oG2antt)
		TemplateDef = [dim var_Items,h]
		TemplateDef = var_Items
		TemplateDef = h
		Template = [var_Items.ItemBar(h,"K1",15) = 18]
	endwith
	var_Items.AddBar(h,"Task","01/02/2001","01/04/2001","K2")
	// var_Items.ItemBar(h,"K2",15) = 17
	with (oG2antt)
		TemplateDef = [dim var_Items,h]
		TemplateDef = var_Items
		TemplateDef = h
		Template = [var_Items.ItemBar(h,"K2",15) = 17]
	endwith
	var_Items.AddBar(h,"Task","01/02/2001","01/04/2001","K3")
	// var_Items.ItemBar(h,"K3",15) = 16
	with (oG2antt)
		TemplateDef = [dim var_Items,h]
		TemplateDef = var_Items
		TemplateDef = h
		Template = [var_Items.ItemBar(h,"K3",15) = 16]
	endwith
oG2antt.EndUpdate()
|
|
1988
|
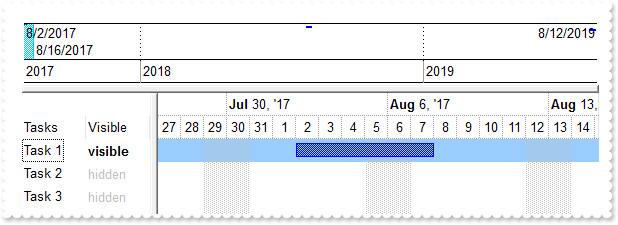
Is it possible to determine whether a bar is in the current display area
/*
with (this.EXG2ANTTCHARTACTIVEXCONTROL1.nativeObject)
	BarResizing = class::nativeObject_BarResizing
endwith
*/
// Occurs when a bar is moving or resizing.
function nativeObject_BarResizing(Item, Key)
	oG2antt = form.EXG2ANTTCHARTACTIVEXCONTROL1.nativeObject
	oG2antt.Refresh()
return

/*
with (this.EXG2ANTTCHARTACTIVEXCONTROL1.nativeObject)
	DateChange = class::nativeObject_DateChange
endwith
*/
// Occurs when the first visible date is changed.
function nativeObject_DateChange()
	oG2antt = form.EXG2ANTTCHARTACTIVEXCONTROL1.nativeObject
	oG2antt.Refresh()
return

/*
with (this.EXG2ANTTCHARTACTIVEXCONTROL1.nativeObject)
	FormatColumn = class::nativeObject_FormatColumn
endwith
*/
// Fired when a cell requires to format its caption.
function nativeObject_FormatColumn(Item, ColIndex, Value)
	local e,l,r,s
	oG2antt = form.EXG2ANTTCHARTACTIVEXCONTROL1.nativeObject
	s = oG2antt.Items.ItemBar(Item,"A",1)
	e = oG2antt.Items.ItemBar(Item,"A",2)
	l = oG2antt.FormatABC("A < B",e,oG2antt.Chart.FirstVisibleDate)
	r = oG2antt.FormatABC("A > B",s,oG2antt.Chart.DateFromPoint(1,-1))
	Value = oG2antt.FormatABC("( A or B ) ? `<fgcolor=C0C0C0>hidden` : `<b>visible`",l,r)
return

/*
with (this.EXG2ANTTCHARTACTIVEXCONTROL1.nativeObject)
	LayoutChanged = class::nativeObject_LayoutChanged
endwith
*/
// Occurs when column's position or column's size is changed.
function nativeObject_LayoutChanged()
	oG2antt = form.EXG2ANTTCHARTACTIVEXCONTROL1.nativeObject
	oG2antt.Refresh()
return

local oG2antt,var_Chart,var_Column,var_Items

oG2antt = form.EXG2ANTTCHARTACTIVEXCONTROL1.nativeObject
oG2antt.BeginUpdate()
oG2antt.SelBackMode = 1
oG2antt.Columns.Add("Tasks")
var_Column = oG2antt.Columns.Add("Visible")
	var_Column.FireFormatColumn = true
	// var_Column.Def(17) = 1
	with (oG2antt)
		TemplateDef = [dim var_Column]
		TemplateDef = var_Column
		Template = [var_Column.Def(17) = 1]
	endwith
var_Chart = oG2antt.Chart
	var_Chart.OverviewVisible = -1
	var_Chart.OverviewHeight = 64
	var_Chart.FirstVisibleDate = "08/01/2017"
	var_Chart.LevelCount = 2
	// var_Chart.PaneWidth(false) = 128
	with (oG2antt)
		TemplateDef = [dim var_Chart]
		TemplateDef = var_Chart
		Template = [var_Chart.PaneWidth(False) = 128]
	endwith
	var_Chart.SelBackColor = oG2antt.SelBackColor
	var_Chart.SelBarColor = 0x808080
oG2antt.SelBackColor = oG2antt.BackColor
oG2antt.SelForeColor = oG2antt.ForeColor
var_Items = oG2antt.Items
	var_Items.AddBar(var_Items.AddItem("Task 1"),"Task","08/02/2017","08/08/2017","A")
	var_Items.AddBar(var_Items.AddItem("Task 2"),"Task","08/03/2018","08/10/2018","A")
	var_Items.AddBar(var_Items.AddItem("Task 3"),"Task","08/04/2019","08/12/2019","A")
	// var_Items.SelectItem(var_Items.FocusItem) = true
	with (oG2antt)
		TemplateDef = [dim var_Items]
		TemplateDef = var_Items
		Template = [var_Items.SelectItem(FocusItem) = True]
	endwith
oG2antt.EndUpdate()
|
|
1987
|
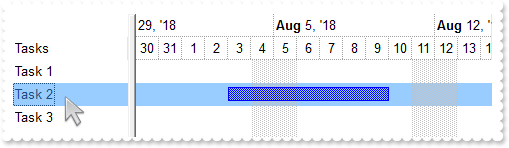
How can I ensure that the bar fits the control's client area
/*
with (this.EXG2ANTTCHARTACTIVEXCONTROL1.nativeObject)
	SelectionChanged = class::nativeObject_SelectionChanged
endwith
*/
// Fired after a new item has been selected.
function nativeObject_SelectionChanged()
	local h,k,s
	oG2antt = form.EXG2ANTTCHARTACTIVEXCONTROL1.nativeObject
	h = oG2antt.Items.FocusItem
	k = oG2antt.Items.FirstItemBar(h)
	s = oG2antt.FormatABC("(A+B)/2",oG2antt.Items.ItemBar(h,k,1),oG2antt.Items.ItemBar(h,k,2))
	oG2antt.Chart.ScrollTo(s,1)
return

local oG2antt,var_Chart,var_Items

oG2antt = form.EXG2ANTTCHARTACTIVEXCONTROL1.nativeObject
oG2antt.BeginUpdate()
oG2antt.SelBackMode = 1
oG2antt.Columns.Add("Tasks")
var_Chart = oG2antt.Chart
	var_Chart.FirstVisibleDate = "08/01/2017"
	var_Chart.LevelCount = 2
	// var_Chart.PaneWidth(false) = 128
	with (oG2antt)
		TemplateDef = [dim var_Chart]
		TemplateDef = var_Chart
		Template = [var_Chart.PaneWidth(False) = 128]
	endwith
	var_Chart.SelBackColor = oG2antt.SelBackColor
	var_Chart.SelBarColor = 0x808080
var_Items = oG2antt.Items
	var_Items.AddBar(var_Items.AddItem("Task 1"),"Task","08/02/2017","08/08/2017")
	var_Items.AddBar(var_Items.AddItem("Task 2"),"Task","08/03/2018","08/10/2018")
	var_Items.AddBar(var_Items.AddItem("Task 3"),"Task","08/04/2019","08/12/2019")
	// var_Items.SelectItem(var_Items.FocusItem) = true
	with (oG2antt)
		TemplateDef = [dim var_Items]
		TemplateDef = var_Items
		Template = [var_Items.SelectItem(FocusItem) = True]
	endwith
oG2antt.EndUpdate()
|
|
1986
|
Is it possible to change the caption from a column without to remove the column and add it with the new caption
local oG2antt,var_Column,var_Column1

oG2antt = form.EXG2ANTTCHARTACTIVEXCONTROL1.nativeObject
// oG2antt.Columns.Add("ColumnName").Caption = "NewName"
var_Column = oG2antt.Columns.Add("ColumnName")
with (oG2antt)
	TemplateDef = [dim var_Column]
	TemplateDef = var_Column
	Template = [var_Column.Caption = "NewName"]
endwith
// oG2antt.Columns.Add("ColumnName").HTMLCaption = "<b>New</b>Name"
var_Column1 = oG2antt.Columns.Add("ColumnName")
with (oG2antt)
	TemplateDef = [dim var_Column1]
	TemplateDef = var_Column1
	Template = [var_Column1.HTMLCaption = "<b>New</b>Name"]
endwith
|
|
1985
|
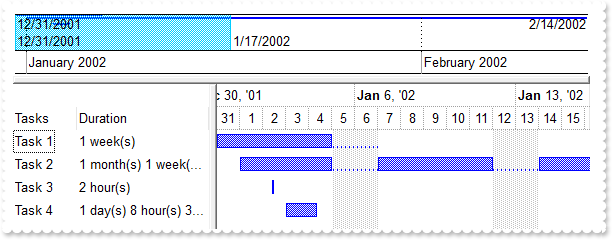
How can I display the bar's duration in days, minutes, and so so on
local h,oG2antt,var_Bar,var_Chart,var_Column,var_Column1,var_Columns,var_Items

oG2antt = form.EXG2ANTTCHARTACTIVEXCONTROL1.nativeObject
oG2antt.BeginUpdate()
var_Columns = oG2antt.Columns
	// var_Columns.Add("Tasks").AllowSizing = false
	var_Column = var_Columns.Add("Tasks")
	with (oG2antt)
		TemplateDef = [dim var_Column]
		TemplateDef = var_Column
		Template = [var_Column.AllowSizing = False]
	endwith
	var_Column1 = var_Columns.Add("Duration")
		// var_Column1.Def(18) = 513
		with (oG2antt)
			TemplateDef = [dim var_Column1]
			TemplateDef = var_Column1
			Template = [var_Column1.Def(18) = 513]
		endwith
		// var_Column1.Def(19) = "A"
		with (oG2antt)
			TemplateDef = [dim var_Column1]
			TemplateDef = var_Column1
			Template = [var_Column1.Def(19) = "A"]
		endwith
		var_Column1.FormatColumn = "trim((1:=int((0:=value)/365) ? =:1 + ` year(s) ` : ``)  + (1:=int((0:=(=:0 - (=:1*365)))/31) ? =:1 + ` month(s) ` : ``) + (1:=int((0:=(=:0 - (=:1*31)))/7) ? =:1 + ` week(s) ` : ``) + (1:=int((0:=(=:0 - (=:1*7)))/1) ? =:1 + ` day(s) ` : ``) + (1:=int((0:=(=:0 - =:1 + 1/24/60/60/2))*24) ? =:1 + ` hour(s) ` : ``) + (1:=int((0:=(=:0*24 - =:1))*60) ? =:1 + ` min(s) ` : ``) + (1:=int((0:=(=:0*60 - =:1))*60) ? =:1 + ` sec(s)` : ``))"
oG2antt.Items.AllowCellValueToItemBar = true
var_Chart = oG2antt.Chart
	var_Chart.FirstVisibleDate = "12/30/2001"
	var_Chart.LevelCount = 2
	// var_Chart.PaneWidth(false) = 196
	with (oG2antt)
		TemplateDef = [dim var_Chart]
		TemplateDef = var_Chart
		Template = [var_Chart.PaneWidth(False) = 196]
	endwith
	// var_Chart.Bars.Add("Task:Split").Shortcut = "Task"
	var_Bar = var_Chart.Bars.Add("Task:Split")
	with (oG2antt)
		TemplateDef = [dim var_Bar]
		TemplateDef = var_Bar
		Template = [var_Bar.Shortcut = "Task"]
	endwith
	var_Chart.OverviewVisible = -1
	var_Chart.OverviewHeight = 64
	var_Chart.ResizeUnitScale = 16777216
	var_Chart.AllowResizeChart = 262 /*exAllowChangeUnitScale | exAllowResizeChartMiddle | exAllowResizeChartHeader*/
var_Items = oG2antt.Items
	h = var_Items.AddItem("Task 1")
	var_Items.AddBar(h,"Task","12/31/2001","01/07/2002","A")
	h = var_Items.AddItem("Task 2")
	var_Items.AddBar(h,"Task","01/01/2002","02/14/2002","A")
	h = var_Items.AddItem("Task 3")
	var_Items.AddBar(h,"Task","01/02/2002 10:00:00","01/02/2002 12:00:00","A")
	h = var_Items.AddItem("Task 4")
	var_Items.AddBar(h,"Task","01/03/2002","01/04/2002 08:30:30","A")
oG2antt.EndUpdate()
|
|
1984
|
How can I change the background color for checked items (EBN color, frame)
/*
with (this.EXG2ANTTCHARTACTIVEXCONTROL1.nativeObject)
	CellStateChanged = class::nativeObject_CellStateChanged
endwith
*/
// Fired after cell's state has been changed.
function nativeObject_CellStateChanged(Item, ColIndex)
	oG2antt = form.EXG2ANTTCHARTACTIVEXCONTROL1.nativeObject
	oG2antt.Refresh()
return

local h,hChild,oG2antt,var_Appearance,var_Bar,var_Chart,var_Column,var_ConditionalFormat,var_Items

oG2antt = form.EXG2ANTTCHARTACTIVEXCONTROL1.nativeObject
oG2antt.BeginUpdate()
oG2antt.LinesAtRoot = -1
oG2antt.SelBackMode = 1
oG2antt.DefaultItemHeight = 22
var_Column = oG2antt.Columns.Add("Tasks")
	// var_Column.Def(0) = true
	with (oG2antt)
		TemplateDef = [dim var_Column]
		TemplateDef = var_Column
		Template = [var_Column.Def(0) = True]
	endwith
	var_Column.PartialCheck = true
var_Appearance = oG2antt.VisualAppearance
	var_Appearance.Add(2,"gBFLBCJwBAEHhEJAAEhABUkIQAAYAQGKIcBiAKBQAGYBIJDEMQ3DjAUBjMK4ZwTC4AIQjCK4JDKHYJRpHEZgLBMJAAGIZYhhUYRUiYMkiJBGGDIDiGGI2SJAcbTVIEcx9EyUJSgSTJOjCMokTTIU4TTLYASbJafJJhWSaAiyMouDIOMg1BDNIw/Hika6jOgKUisNJXRzWIBTbDlOQ3JqnbCjOQRSrQBoNDAMAiiaKlbwJPK9RoieQXfwUAJrXJcFqXFSLVxNBKAQEBA=")
	var_Appearance.Add(1,"CP:2 1 1 -1 -1")
var_ConditionalFormat = oG2antt.ConditionalFormats.Add("%CS0 = 1")
	var_ConditionalFormat.BackColor = 0x1000000
	var_ConditionalFormat.ChartBackColor = var_ConditionalFormat.BackColor
oG2antt.HeaderVisible = 1
var_Chart = oG2antt.Chart
	var_Chart.FirstVisibleDate = "08/01/2017"
	var_Chart.LevelCount = 2
	// var_Chart.PaneWidth(false) = 128
	with (oG2antt)
		TemplateDef = [dim var_Chart]
		TemplateDef = var_Chart
		Template = [var_Chart.PaneWidth(False) = 128]
	endwith
	var_Bar = var_Chart.Bars.Item("Summary")
		var_Bar.StartShape = 0
		var_Bar.EndShape = 0
		var_Bar.Shape = 20
	var_Chart.SelBackColor = oG2antt.SelBackColor
	var_Chart.SelBarColor = 0x808080
var_Items = oG2antt.Items
	h = var_Items.AddItem("Project")
	hChild = var_Items.InsertItem(h,null,"Task 1")
	var_Items.AddBar(hChild,"Task","08/02/2017","08/08/2017")
	// var_Items.SelectItem(hChild) = true
	with (oG2antt)
		TemplateDef = [dim var_Items,hChild]
		TemplateDef = var_Items
		TemplateDef = hChild
		Template = [var_Items.SelectItem(hChild) = True]
	endwith
	hChild = var_Items.InsertItem(h,null,"Task 2")
	var_Items.AddBar(hChild,"Task","08/03/2017","08/10/2017")
	// var_Items.CellState(hChild,0) = 1
	with (oG2antt)
		TemplateDef = [dim var_Items,hChild]
		TemplateDef = var_Items
		TemplateDef = hChild
		Template = [var_Items.CellState(hChild,0) = 1]
	endwith
	hChild = var_Items.InsertItem(h,null,"Task 3")
	var_Items.AddBar(hChild,"Task","08/04/2017","08/12/2017")
	// var_Items.CellState(hChild,0) = 1
	with (oG2antt)
		TemplateDef = [dim var_Items,hChild]
		TemplateDef = var_Items
		TemplateDef = hChild
		Template = [var_Items.CellState(hChild,0) = 1]
	endwith
	var_Items.AddBar(h,"Summary","08/01/2017","08/01/2017","sum")
	var_Items.DefineSummaryBars(h,"sum",-3,"")
	// var_Items.ExpandItem(h) = true
	with (oG2antt)
		TemplateDef = [dim var_Items,h]
		TemplateDef = var_Items
		TemplateDef = h
		Template = [var_Items.ExpandItem(h) = True]
	endwith
oG2antt.EndUpdate()
|
|
1983
|
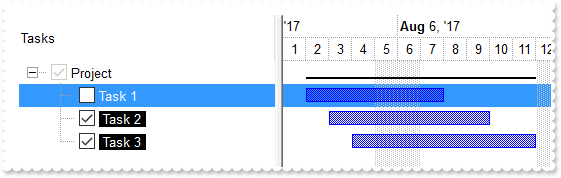
How can I change the caption of the checked items (sample 2)
local h,hChild,oG2antt,var_Bar,var_Chart,var_Column,var_Items

oG2antt = form.EXG2ANTTCHARTACTIVEXCONTROL1.nativeObject
oG2antt.BeginUpdate()
oG2antt.LinesAtRoot = -1
oG2antt.SelBackColor = oG2antt.BackColor
oG2antt.SelForeColor = oG2antt.ForeColor
var_Column = oG2antt.Columns.Add("Tasks")
	// var_Column.Def(0) = true
	with (oG2antt)
		TemplateDef = [dim var_Column]
		TemplateDef = var_Column
		Template = [var_Column.Def(0) = True]
	endwith
	var_Column.PartialCheck = true
	// var_Column.Def(17) = 1
	with (oG2antt)
		TemplateDef = [dim var_Column]
		TemplateDef = var_Column
		Template = [var_Column.Def(17) = 1]
	endwith
	var_Column.FormatColumn = "%CS0 = 1 ? `<bgcolor=000000><fgcolor=FFFFFF> ` + value + ` </fgcolor></bgcolor>` : value"
oG2antt.HeaderVisible = 1
var_Chart = oG2antt.Chart
	var_Chart.FirstVisibleDate = "08/01/2017"
	var_Chart.LevelCount = 2
	// var_Chart.PaneWidth(false) = 256
	with (oG2antt)
		TemplateDef = [dim var_Chart]
		TemplateDef = var_Chart
		Template = [var_Chart.PaneWidth(False) = 256]
	endwith
	var_Bar = var_Chart.Bars.Item("Summary")
		var_Bar.StartShape = 0
		var_Bar.EndShape = 0
		var_Bar.Shape = 20
	var_Chart.SelBackColor = oG2antt.SelBackColor
	var_Chart.SelBarColor = 0x808080
var_Items = oG2antt.Items
	h = var_Items.AddItem("Project")
	hChild = var_Items.InsertItem(h,null,"Task 1")
	var_Items.AddBar(hChild,"Task","08/02/2017","08/08/2017")
	// var_Items.SelectItem(hChild) = true
	with (oG2antt)
		TemplateDef = [dim var_Items,hChild]
		TemplateDef = var_Items
		TemplateDef = hChild
		Template = [var_Items.SelectItem(hChild) = True]
	endwith
	hChild = var_Items.InsertItem(h,null,"Task 2")
	var_Items.AddBar(hChild,"Task","08/03/2017","08/10/2017")
	// var_Items.CellState(hChild,0) = 1
	with (oG2antt)
		TemplateDef = [dim var_Items,hChild]
		TemplateDef = var_Items
		TemplateDef = hChild
		Template = [var_Items.CellState(hChild,0) = 1]
	endwith
	hChild = var_Items.InsertItem(h,null,"Task 3")
	var_Items.AddBar(hChild,"Task","08/04/2017","08/12/2017")
	// var_Items.CellState(hChild,0) = 1
	with (oG2antt)
		TemplateDef = [dim var_Items,hChild]
		TemplateDef = var_Items
		TemplateDef = hChild
		Template = [var_Items.CellState(hChild,0) = 1]
	endwith
	var_Items.AddBar(h,"Summary","08/01/2017","08/01/2017","sum")
	var_Items.DefineSummaryBars(h,"sum",-3,"")
	// var_Items.ExpandItem(h) = true
	with (oG2antt)
		TemplateDef = [dim var_Items,h]
		TemplateDef = var_Items
		TemplateDef = h
		Template = [var_Items.ExpandItem(h) = True]
	endwith
oG2antt.EndUpdate()
|
|
1982
|
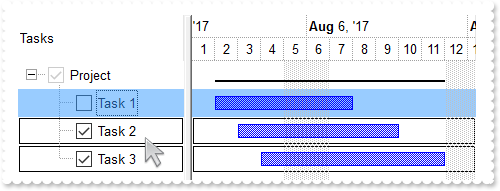
How can I change the caption of the checked items (sample 1)
local h,hChild,oG2antt,var_Bar,var_Chart,var_Column,var_Items

oG2antt = form.EXG2ANTTCHARTACTIVEXCONTROL1.nativeObject
oG2antt.BeginUpdate()
oG2antt.LinesAtRoot = -1
var_Column = oG2antt.Columns.Add("Tasks")
	// var_Column.Def(0) = true
	with (oG2antt)
		TemplateDef = [dim var_Column]
		TemplateDef = var_Column
		Template = [var_Column.Def(0) = True]
	endwith
	var_Column.PartialCheck = true
	// var_Column.Def(17) = 1
	with (oG2antt)
		TemplateDef = [dim var_Column]
		TemplateDef = var_Column
		Template = [var_Column.Def(17) = 1]
	endwith
	var_Column.FormatColumn = "value + (%CS0 = 1 ? `<r><fgcolor=808080>(checked)` : ``)"
oG2antt.HeaderVisible = 1
var_Chart = oG2antt.Chart
	var_Chart.FirstVisibleDate = "08/01/2017"
	var_Chart.LevelCount = 2
	// var_Chart.PaneWidth(false) = 256
	with (oG2antt)
		TemplateDef = [dim var_Chart]
		TemplateDef = var_Chart
		Template = [var_Chart.PaneWidth(False) = 256]
	endwith
	var_Bar = var_Chart.Bars.Item("Summary")
		var_Bar.StartShape = 0
		var_Bar.EndShape = 0
		var_Bar.Shape = 20
	var_Chart.SelBackColor = oG2antt.SelBackColor
	var_Chart.SelBarColor = 0x808080
var_Items = oG2antt.Items
	h = var_Items.AddItem("Project")
	hChild = var_Items.InsertItem(h,null,"Task 1")
	var_Items.AddBar(hChild,"Task","08/02/2017","08/08/2017")
	// var_Items.SelectItem(hChild) = true
	with (oG2antt)
		TemplateDef = [dim var_Items,hChild]
		TemplateDef = var_Items
		TemplateDef = hChild
		Template = [var_Items.SelectItem(hChild) = True]
	endwith
	hChild = var_Items.InsertItem(h,null,"Task 2")
	var_Items.AddBar(hChild,"Task","08/03/2017","08/10/2017")
	// var_Items.CellState(hChild,0) = 1
	with (oG2antt)
		TemplateDef = [dim var_Items,hChild]
		TemplateDef = var_Items
		TemplateDef = hChild
		Template = [var_Items.CellState(hChild,0) = 1]
	endwith
	hChild = var_Items.InsertItem(h,null,"Task 3")
	var_Items.AddBar(hChild,"Task","08/04/2017","08/12/2017")
	// var_Items.CellState(hChild,0) = 1
	with (oG2antt)
		TemplateDef = [dim var_Items,hChild]
		TemplateDef = var_Items
		TemplateDef = hChild
		Template = [var_Items.CellState(hChild,0) = 1]
	endwith
	var_Items.AddBar(h,"Summary","08/01/2017","08/01/2017","sum")
	var_Items.DefineSummaryBars(h,"sum",-3,"")
	// var_Items.ExpandItem(h) = true
	with (oG2antt)
		TemplateDef = [dim var_Items,h]
		TemplateDef = var_Items
		TemplateDef = h
		Template = [var_Items.ExpandItem(h) = True]
	endwith
oG2antt.EndUpdate()
|
|
1981
|
How can I change the font for the checked items
/*
with (this.EXG2ANTTCHARTACTIVEXCONTROL1.nativeObject)
	CellStateChanged = class::nativeObject_CellStateChanged
endwith
*/
// Fired after cell's state has been changed.
function nativeObject_CellStateChanged(Item, ColIndex)
	oG2antt = form.EXG2ANTTCHARTACTIVEXCONTROL1.nativeObject
	oG2antt.Refresh()
return

local f,h,hChild,oG2antt,var_Bar,var_Chart,var_Column,var_ConditionalFormat,var_Items

oG2antt = form.EXG2ANTTCHARTACTIVEXCONTROL1.nativeObject
oG2antt.BeginUpdate()
oG2antt.LinesAtRoot = -1
oG2antt.DefaultItemHeight = 22
var_Column = oG2antt.Columns.Add("Tasks")
	// var_Column.Def(0) = true
	with (oG2antt)
		TemplateDef = [dim var_Column]
		TemplateDef = var_Column
		Template = [var_Column.Def(0) = True]
	endwith
	var_Column.PartialCheck = true
var_ConditionalFormat = oG2antt.ConditionalFormats.Add("%CS0 = 1")
	f = new OleAutoClient("StdFont")
		f.Name = oG2antt.Font.Name
		f.Size = 12
	var_ConditionalFormat.Font = f
oG2antt.HeaderVisible = 1
var_Chart = oG2antt.Chart
	var_Chart.FirstVisibleDate = "08/01/2017"
	var_Chart.LevelCount = 2
	// var_Chart.PaneWidth(false) = 196
	with (oG2antt)
		TemplateDef = [dim var_Chart]
		TemplateDef = var_Chart
		Template = [var_Chart.PaneWidth(False) = 196]
	endwith
	var_Bar = var_Chart.Bars.Item("Summary")
		var_Bar.StartShape = 0
		var_Bar.EndShape = 0
		var_Bar.Shape = 20
	var_Chart.SelBackColor = oG2antt.SelBackColor
	var_Chart.SelBarColor = 0x808080
var_Items = oG2antt.Items
	h = var_Items.AddItem("Project")
	hChild = var_Items.InsertItem(h,null,"Task 1")
	var_Items.AddBar(hChild,"Task","08/02/2017","08/08/2017")
	// var_Items.SelectItem(hChild) = true
	with (oG2antt)
		TemplateDef = [dim var_Items,hChild]
		TemplateDef = var_Items
		TemplateDef = hChild
		Template = [var_Items.SelectItem(hChild) = True]
	endwith
	hChild = var_Items.InsertItem(h,null,"Task 2")
	var_Items.AddBar(hChild,"Task","08/03/2017","08/10/2017")
	// var_Items.CellState(hChild,0) = 1
	with (oG2antt)
		TemplateDef = [dim var_Items,hChild]
		TemplateDef = var_Items
		TemplateDef = hChild
		Template = [var_Items.CellState(hChild,0) = 1]
	endwith
	hChild = var_Items.InsertItem(h,null,"Task 3")
	var_Items.AddBar(hChild,"Task","08/04/2017","08/12/2017")
	// var_Items.CellState(hChild,0) = 1
	with (oG2antt)
		TemplateDef = [dim var_Items,hChild]
		TemplateDef = var_Items
		TemplateDef = hChild
		Template = [var_Items.CellState(hChild,0) = 1]
	endwith
	var_Items.AddBar(h,"Summary","08/01/2017","08/01/2017","sum")
	var_Items.DefineSummaryBars(h,"sum",-3,"")
	// var_Items.ExpandItem(h) = true
	with (oG2antt)
		TemplateDef = [dim var_Items,h]
		TemplateDef = var_Items
		TemplateDef = h
		Template = [var_Items.ExpandItem(h) = True]
	endwith
oG2antt.EndUpdate()
|
|
1980
|
How can I bold the checked items
/*
with (this.EXG2ANTTCHARTACTIVEXCONTROL1.nativeObject)
	CellStateChanged = class::nativeObject_CellStateChanged
endwith
*/
// Fired after cell's state has been changed.
function nativeObject_CellStateChanged(Item, ColIndex)
	oG2antt = form.EXG2ANTTCHARTACTIVEXCONTROL1.nativeObject
	oG2antt.Refresh()
return

local h,hChild,oG2antt,var_Bar,var_Chart,var_Column,var_ConditionalFormat,var_Items

oG2antt = form.EXG2ANTTCHARTACTIVEXCONTROL1.nativeObject
oG2antt.BeginUpdate()
oG2antt.LinesAtRoot = -1
var_Column = oG2antt.Columns.Add("Tasks")
	// var_Column.Def(0) = true
	with (oG2antt)
		TemplateDef = [dim var_Column]
		TemplateDef = var_Column
		Template = [var_Column.Def(0) = True]
	endwith
	var_Column.PartialCheck = true
var_ConditionalFormat = oG2antt.ConditionalFormats.Add("%CS0 = 1")
	var_ConditionalFormat.Bold = true
oG2antt.HeaderVisible = 1
var_Chart = oG2antt.Chart
	var_Chart.FirstVisibleDate = "08/01/2017"
	var_Chart.LevelCount = 2
	// var_Chart.PaneWidth(false) = 128
	with (oG2antt)
		TemplateDef = [dim var_Chart]
		TemplateDef = var_Chart
		Template = [var_Chart.PaneWidth(False) = 128]
	endwith
	var_Bar = var_Chart.Bars.Item("Summary")
		var_Bar.StartShape = 0
		var_Bar.EndShape = 0
		var_Bar.Shape = 20
	var_Chart.SelBackColor = oG2antt.SelBackColor
	var_Chart.SelBarColor = 0x808080
var_Items = oG2antt.Items
	h = var_Items.AddItem("Project")
	hChild = var_Items.InsertItem(h,null,"Task 1")
	var_Items.AddBar(hChild,"Task","08/02/2017","08/08/2017")
	// var_Items.SelectItem(hChild) = true
	with (oG2antt)
		TemplateDef = [dim var_Items,hChild]
		TemplateDef = var_Items
		TemplateDef = hChild
		Template = [var_Items.SelectItem(hChild) = True]
	endwith
	hChild = var_Items.InsertItem(h,null,"Task 2")
	var_Items.AddBar(hChild,"Task","08/03/2017","08/10/2017")
	// var_Items.CellState(hChild,0) = 1
	with (oG2antt)
		TemplateDef = [dim var_Items,hChild]
		TemplateDef = var_Items
		TemplateDef = hChild
		Template = [var_Items.CellState(hChild,0) = 1]
	endwith
	hChild = var_Items.InsertItem(h,null,"Task 3")
	var_Items.AddBar(hChild,"Task","08/04/2017","08/12/2017")
	// var_Items.CellState(hChild,0) = 1
	with (oG2antt)
		TemplateDef = [dim var_Items,hChild]
		TemplateDef = var_Items
		TemplateDef = hChild
		Template = [var_Items.CellState(hChild,0) = 1]
	endwith
	var_Items.AddBar(h,"Summary","08/01/2017","08/01/2017","sum")
	var_Items.DefineSummaryBars(h,"sum",-3,"")
	// var_Items.ExpandItem(h) = true
	with (oG2antt)
		TemplateDef = [dim var_Items,h]
		TemplateDef = var_Items
		TemplateDef = h
		Template = [var_Items.ExpandItem(h) = True]
	endwith
oG2antt.EndUpdate()
|
|
1979
|
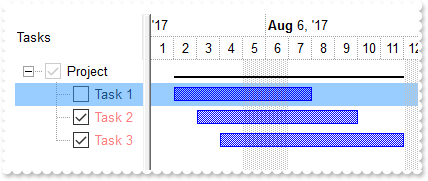
How can I change the foreground color for checked items
/*
with (this.EXG2ANTTCHARTACTIVEXCONTROL1.nativeObject)
	CellStateChanged = class::nativeObject_CellStateChanged
endwith
*/
// Fired after cell's state has been changed.
function nativeObject_CellStateChanged(Item, ColIndex)
	oG2antt = form.EXG2ANTTCHARTACTIVEXCONTROL1.nativeObject
	oG2antt.Refresh()
return

local h,hChild,oG2antt,var_Bar,var_Chart,var_Column,var_ConditionalFormat,var_Items

oG2antt = form.EXG2ANTTCHARTACTIVEXCONTROL1.nativeObject
oG2antt.BeginUpdate()
oG2antt.LinesAtRoot = -1
oG2antt.SelBackMode = 1
var_Column = oG2antt.Columns.Add("Tasks")
	// var_Column.Def(0) = true
	with (oG2antt)
		TemplateDef = [dim var_Column]
		TemplateDef = var_Column
		Template = [var_Column.Def(0) = True]
	endwith
	var_Column.PartialCheck = true
var_ConditionalFormat = oG2antt.ConditionalFormats.Add("%CS0 = 1")
	var_ConditionalFormat.ForeColor = 0x8080ff
oG2antt.HeaderVisible = 1
var_Chart = oG2antt.Chart
	var_Chart.FirstVisibleDate = "08/01/2017"
	var_Chart.LevelCount = 2
	// var_Chart.PaneWidth(false) = 128
	with (oG2antt)
		TemplateDef = [dim var_Chart]
		TemplateDef = var_Chart
		Template = [var_Chart.PaneWidth(False) = 128]
	endwith
	var_Bar = var_Chart.Bars.Item("Summary")
		var_Bar.StartShape = 0
		var_Bar.EndShape = 0
		var_Bar.Shape = 20
	var_Chart.SelBackColor = oG2antt.SelBackColor
	var_Chart.SelBarColor = 0x808080
var_Items = oG2antt.Items
	h = var_Items.AddItem("Project")
	hChild = var_Items.InsertItem(h,null,"Task 1")
	var_Items.AddBar(hChild,"Task","08/02/2017","08/08/2017")
	// var_Items.SelectItem(hChild) = true
	with (oG2antt)
		TemplateDef = [dim var_Items,hChild]
		TemplateDef = var_Items
		TemplateDef = hChild
		Template = [var_Items.SelectItem(hChild) = True]
	endwith
	hChild = var_Items.InsertItem(h,null,"Task 2")
	var_Items.AddBar(hChild,"Task","08/03/2017","08/10/2017")
	// var_Items.CellState(hChild,0) = 1
	with (oG2antt)
		TemplateDef = [dim var_Items,hChild]
		TemplateDef = var_Items
		TemplateDef = hChild
		Template = [var_Items.CellState(hChild,0) = 1]
	endwith
	hChild = var_Items.InsertItem(h,null,"Task 3")
	var_Items.AddBar(hChild,"Task","08/04/2017","08/12/2017")
	// var_Items.CellState(hChild,0) = 1
	with (oG2antt)
		TemplateDef = [dim var_Items,hChild]
		TemplateDef = var_Items
		TemplateDef = hChild
		Template = [var_Items.CellState(hChild,0) = 1]
	endwith
	var_Items.AddBar(h,"Summary","08/01/2017","08/01/2017","sum")
	var_Items.DefineSummaryBars(h,"sum",-3,"")
	// var_Items.ExpandItem(h) = true
	with (oG2antt)
		TemplateDef = [dim var_Items,h]
		TemplateDef = var_Items
		TemplateDef = h
		Template = [var_Items.ExpandItem(h) = True]
	endwith
oG2antt.EndUpdate()
|
|
1978
|
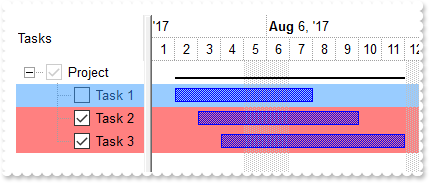
How can I change the background color for checked items (solid color)
/*
with (this.EXG2ANTTCHARTACTIVEXCONTROL1.nativeObject)
	CellStateChanged = class::nativeObject_CellStateChanged
endwith
*/
// Fired after cell's state has been changed.
function nativeObject_CellStateChanged(Item, ColIndex)
	oG2antt = form.EXG2ANTTCHARTACTIVEXCONTROL1.nativeObject
	oG2antt.Refresh()
return

local h,hChild,oG2antt,var_Bar,var_Chart,var_Column,var_ConditionalFormat,var_Items

oG2antt = form.EXG2ANTTCHARTACTIVEXCONTROL1.nativeObject
oG2antt.BeginUpdate()
oG2antt.LinesAtRoot = -1
oG2antt.SelBackMode = 1
var_Column = oG2antt.Columns.Add("Tasks")
	// var_Column.Def(0) = true
	with (oG2antt)
		TemplateDef = [dim var_Column]
		TemplateDef = var_Column
		Template = [var_Column.Def(0) = True]
	endwith
	var_Column.PartialCheck = true
var_ConditionalFormat = oG2antt.ConditionalFormats.Add("%CS0 = 1")
	var_ConditionalFormat.BackColor = 0x8080ff
	var_ConditionalFormat.ChartBackColor = var_ConditionalFormat.BackColor
oG2antt.HeaderVisible = 1
var_Chart = oG2antt.Chart
	var_Chart.FirstVisibleDate = "08/01/2017"
	var_Chart.LevelCount = 2
	// var_Chart.PaneWidth(false) = 128
	with (oG2antt)
		TemplateDef = [dim var_Chart]
		TemplateDef = var_Chart
		Template = [var_Chart.PaneWidth(False) = 128]
	endwith
	var_Bar = var_Chart.Bars.Item("Summary")
		var_Bar.StartShape = 0
		var_Bar.EndShape = 0
		var_Bar.Shape = 20
	var_Chart.SelBackColor = oG2antt.SelBackColor
	var_Chart.SelBarColor = 0x808080
var_Items = oG2antt.Items
	h = var_Items.AddItem("Project")
	hChild = var_Items.InsertItem(h,null,"Task 1")
	var_Items.AddBar(hChild,"Task","08/02/2017","08/08/2017")
	// var_Items.SelectItem(hChild) = true
	with (oG2antt)
		TemplateDef = [dim var_Items,hChild]
		TemplateDef = var_Items
		TemplateDef = hChild
		Template = [var_Items.SelectItem(hChild) = True]
	endwith
	hChild = var_Items.InsertItem(h,null,"Task 2")
	var_Items.AddBar(hChild,"Task","08/03/2017","08/10/2017")
	// var_Items.CellState(hChild,0) = 1
	with (oG2antt)
		TemplateDef = [dim var_Items,hChild]
		TemplateDef = var_Items
		TemplateDef = hChild
		Template = [var_Items.CellState(hChild,0) = 1]
	endwith
	hChild = var_Items.InsertItem(h,null,"Task 3")
	var_Items.AddBar(hChild,"Task","08/04/2017","08/12/2017")
	// var_Items.CellState(hChild,0) = 1
	with (oG2antt)
		TemplateDef = [dim var_Items,hChild]
		TemplateDef = var_Items
		TemplateDef = hChild
		Template = [var_Items.CellState(hChild,0) = 1]
	endwith
	var_Items.AddBar(h,"Summary","08/01/2017","08/01/2017","sum")
	var_Items.DefineSummaryBars(h,"sum",-3,"")
	// var_Items.ExpandItem(h) = true
	with (oG2antt)
		TemplateDef = [dim var_Items,h]
		TemplateDef = var_Items
		TemplateDef = h
		Template = [var_Items.ExpandItem(h) = True]
	endwith
oG2antt.EndUpdate()
|
|
1977
|
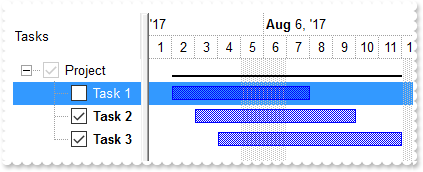
How can I change the color for checked Task bars
local h,hChild,oG2antt,var_Bar,var_Chart,var_Column,var_ConditionalFormat,var_Items

oG2antt = form.EXG2ANTTCHARTACTIVEXCONTROL1.nativeObject
oG2antt.BeginUpdate()
oG2antt.LinesAtRoot = -1
var_Column = oG2antt.Columns.Add("Tasks")
	// var_Column.Def(0) = true
	with (oG2antt)
		TemplateDef = [dim var_Column]
		TemplateDef = var_Column
		Template = [var_Column.Def(0) = True]
	endwith
	var_Column.PartialCheck = true
var_ConditionalFormat = oG2antt.ConditionalFormats.Add("%CS0 = 1")
	var_ConditionalFormat.ApplyToBars = "Task,Summary"
	var_ConditionalFormat.BarColor = 0xff
oG2antt.HeaderVisible = 1
oG2antt.SelBackColor = 0xf0f0f0
oG2antt.SelForeColor = 0x0
var_Chart = oG2antt.Chart
	var_Chart.FirstVisibleDate = "08/01/2017"
	var_Chart.LevelCount = 2
	// var_Chart.PaneWidth(false) = 128
	with (oG2antt)
		TemplateDef = [dim var_Chart]
		TemplateDef = var_Chart
		Template = [var_Chart.PaneWidth(False) = 128]
	endwith
	var_Bar = var_Chart.Bars.Item("Summary")
		var_Bar.StartShape = 0
		var_Bar.EndShape = 0
		var_Bar.Shape = 20
	var_Chart.SelBackColor = oG2antt.SelBackColor
	var_Chart.SelBarColor = 0x808080
var_Items = oG2antt.Items
	h = var_Items.AddItem("Project")
	hChild = var_Items.InsertItem(h,null,"Task 1")
	var_Items.AddBar(hChild,"Task","08/02/2017","08/08/2017")
	// var_Items.SelectItem(hChild) = true
	with (oG2antt)
		TemplateDef = [dim var_Items,hChild]
		TemplateDef = var_Items
		TemplateDef = hChild
		Template = [var_Items.SelectItem(hChild) = True]
	endwith
	hChild = var_Items.InsertItem(h,null,"Task 2")
	var_Items.AddBar(hChild,"Task","08/03/2017","08/10/2017")
	// var_Items.CellState(hChild,0) = 1
	with (oG2antt)
		TemplateDef = [dim var_Items,hChild]
		TemplateDef = var_Items
		TemplateDef = hChild
		Template = [var_Items.CellState(hChild,0) = 1]
	endwith
	hChild = var_Items.InsertItem(h,null,"Task 3")
	var_Items.AddBar(hChild,"Task","08/04/2017","08/12/2017")
	// var_Items.CellState(hChild,0) = 1
	with (oG2antt)
		TemplateDef = [dim var_Items,hChild]
		TemplateDef = var_Items
		TemplateDef = hChild
		Template = [var_Items.CellState(hChild,0) = 1]
	endwith
	var_Items.AddBar(h,"Summary","08/01/2017","08/01/2017","sum")
	var_Items.DefineSummaryBars(h,"sum",-3,"")
	// var_Items.ExpandItem(h) = true
	with (oG2antt)
		TemplateDef = [dim var_Items,h]
		TemplateDef = var_Items
		TemplateDef = h
		Template = [var_Items.ExpandItem(h) = True]
	endwith
oG2antt.EndUpdate()
|
|
1976
|
I have defined "NonWorkingHours" for the Gantt, and the "exBarWorkingCount" properly excludes these hours as long as the Gantt is using "exDay" or "exHour" as the level unit. However when displaying a quarter or a year, I'm changing the unit to "exWeek", but then the "NonWorkingHours" are no longer excluded from the bars "exBarWorkingCount" and displays the wrong value
local h,oG2antt,var_Bar,var_Chart,var_Chart1,var_Column,var_Column1,var_Columns,var_Items,var_Level,var_Level1

oG2antt = form.EXG2ANTTCHARTACTIVEXCONTROL1.nativeObject
oG2antt.BeginUpdate()
var_Columns = oG2antt.Columns
	// var_Columns.Add("Tasks").AllowSizing = false
	var_Column = var_Columns.Add("Tasks")
	with (oG2antt)
		TemplateDef = [dim var_Column]
		TemplateDef = var_Column
		Template = [var_Column.AllowSizing = False]
	endwith
	var_Column1 = var_Columns.Add("Working")
		// var_Column1.Def(18) = 258
		with (oG2antt)
			TemplateDef = [dim var_Column1]
			TemplateDef = var_Column1
			Template = [var_Column1.Def(18) = 258]
		endwith
		// var_Column1.Def(19) = "A"
		with (oG2antt)
			TemplateDef = [dim var_Column1]
			TemplateDef = var_Column1
			Template = [var_Column1.Def(19) = "A"]
		endwith
		var_Column1.FormatColumn = "((1:=int(0:=( 24*int(value) + (value - int(value) + 1/24/60/60/2)*24))) != 0 ? =:1 + ' hour(s)' : '' ) + (=:1 ? ' ' : '' ) + ((1:=round((=:0 - =:1)*60)) != 0 ? =:1 + ' min(s)' : '')"
oG2antt.Items.AllowCellValueToItemBar = true
var_Chart = oG2antt.Chart
	var_Chart.AllowResizeChart = 262 /*exAllowChangeUnitScale | exAllowResizeChartMiddle | exAllowResizeChartHeader*/
	// var_Chart.PaneWidth(false) = 196
	with (oG2antt)
		TemplateDef = [dim var_Chart]
		TemplateDef = var_Chart
		Template = [var_Chart.PaneWidth(False) = 196]
	endwith
	// var_Chart.Bars.Add("Task:Split").Shortcut = "Task"
	var_Bar = var_Chart.Bars.Add("Task:Split")
	with (oG2antt)
		TemplateDef = [dim var_Bar]
		TemplateDef = var_Bar
		Template = [var_Bar.Shortcut = "Task"]
	endwith
	var_Chart.FirstVisibleDate = "01/03/2002"
	var_Chart.LevelCount = 2
	// var_Chart.Level(0).Label = "<%ddd%>"
	var_Level = var_Chart.Level(0)
	with (oG2antt)
		TemplateDef = [dim var_Level]
		TemplateDef = var_Level
		Template = [var_Level.Label = "<%ddd%>"]
	endwith
	// var_Chart.Level(1).Label = "<%hh%>"
	var_Level1 = var_Chart.Level(1)
	with (oG2antt)
		TemplateDef = [dim var_Level1]
		TemplateDef = var_Level1
		Template = [var_Level1.Label = "<%hh%>"]
	endwith
	var_Chart.NonworkingHours = 16761855
	var_Chart.ShowNonworkingUnits = false
	var_Chart.ShowNonworkingUnits = false
	var_Chart.OverviewVisible = -1
	var_Chart.OverviewHeight = 64
	var_Chart.AllowOverviewZoom = 1
var_Items = oG2antt.Items
	h = var_Items.AddItem("Task 1")
	var_Items.AddBar(h,"Task","01/04/2002","01/08/2002","A")
	// var_Items.ItemBar(h,"A",20) = true
	with (oG2antt)
		TemplateDef = [dim var_Items,h]
		TemplateDef = var_Items
		TemplateDef = h
		Template = [var_Items.ItemBar(h,"A",20) = True]
	endwith
	h = var_Items.AddItem("Task 2")
	var_Items.AddBar(h,"Task","01/03/2002","01/04/2002","A")
	// var_Items.ItemBar(h,"A",20) = true
	with (oG2antt)
		TemplateDef = [dim var_Items,h]
		TemplateDef = var_Items
		TemplateDef = h
		Template = [var_Items.ItemBar(h,"A",20) = True]
	endwith
var_Chart1 = oG2antt.Chart
	var_Chart1.UnitScale = 4096
	var_Chart1.ScrollTo(var_Chart1.FirstVisibleDate,1)
oG2antt.EndUpdate()
|
|
1975
|
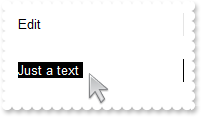
Is it possible to customize the editor selection colour of the built in text editor, from standard blue to black
local oG2antt,var_Chart,var_Chart1,var_Editor,var_Items

oG2antt = form.EXG2ANTTCHARTACTIVEXCONTROL1.nativeObject
oG2antt.BeginUpdate()
// oG2antt.Chart.PaneWidth(true) = 0
var_Chart = oG2antt.Chart
with (oG2antt)
	TemplateDef = [dim var_Chart]
	TemplateDef = var_Chart
	Template = [var_Chart.PaneWidth(True) = 0]
endwith
oG2antt.SelBackColor = 0x0
oG2antt.SelForeColor = 0xffffff
// oG2antt.Chart.PaneWidth(true) = 0
var_Chart1 = oG2antt.Chart
with (oG2antt)
	TemplateDef = [dim var_Chart1]
	TemplateDef = var_Chart1
	Template = [var_Chart1.PaneWidth(True) = 0]
endwith
var_Editor = oG2antt.Columns.Add("Edit").Editor
	var_Editor.EditType = 8
	var_Editor.Mask = ";;;rich"
var_Items = oG2antt.Items
	var_Items.AddItem("")
	var_Items.AddItem("Just a text")
	var_Items.AddItem("")
oG2antt.EndUpdate()
|
|
1974
|
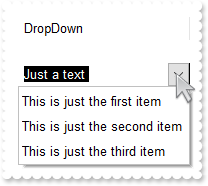
Is it possible to customize the editor selection colour of the built in dropdown editor, from standard blue to black
local oG2antt,var_Chart,var_Editor,var_Items

oG2antt = form.EXG2ANTTCHARTACTIVEXCONTROL1.nativeObject
oG2antt.BeginUpdate()
oG2antt.SelBackColor = 0x0
oG2antt.SelForeColor = 0xffffff
// oG2antt.Chart.PaneWidth(true) = 0
var_Chart = oG2antt.Chart
with (oG2antt)
	TemplateDef = [dim var_Chart]
	TemplateDef = var_Chart
	Template = [var_Chart.PaneWidth(True) = 0]
endwith
var_Editor = oG2antt.Columns.Add("DropDown").Editor
	var_Editor.AddItem(1,"This is just the first item")
	var_Editor.AddItem(2,"This is just the second item")
	var_Editor.AddItem(3,"This is just the third item")
	var_Editor.EditType = 2
	var_Editor.Mask = ";;;rich"
var_Items = oG2antt.Items
	var_Items.AddItem("")
	var_Items.AddItem("Just a text")
	var_Items.AddItem("")
oG2antt.EndUpdate()
|
|
1973
|
When I display the chart in the daily view, the histogram shows correctly the data while if the chart displays the data in weekly or monthly view, the histogram shows no data or incorrectly. What can be the problem
/*
with (this.EXG2ANTTCHARTACTIVEXCONTROL1.nativeObject)
OverviewZoom = class::nativeObject_OverviewZoom
endwith
*/
// Occurs once the user selects a new time scale unit in the overview zoom area.
function nativeObject_OverviewZoom()
oG2antt = form.EXG2ANTTCHARTACTIVEXCONTROL1.nativeObject
oG2antt.Chart.ResizeUnitScale = 4096
return
local h1,oG2antt,var_Bar,var_Chart,var_Column,var_Items
oG2antt = form.EXG2ANTTCHARTACTIVEXCONTROL1.nativeObject
oG2antt.BeginUpdate()
oG2antt.Columns.Add("Tasks")
var_Column = oG2antt.Columns.Add("Effort")
// var_Column.Def(18) = 21
with (oG2antt)
TemplateDef = [dim var_Column]
TemplateDef = var_Column
Template = [var_Column.Def(18) = 21]
endwith
var_Column.Editor.EditType = 4
var_Chart = oG2antt.Chart
var_Chart.AllowOverviewZoom = 1
var_Chart.OverviewZoomCaption = "|||<img>3</img>Month|Third|<img>2</img>Week|<img>1</img>Day|||"
// var_Chart.Label(0) = ""
with (oG2antt)
TemplateDef = [dim var_Chart]
TemplateDef = var_Chart
Template = [var_Chart.Label(0) = ""]
endwith
// var_Chart.Label(1) = ""
with (oG2antt)
TemplateDef = [dim var_Chart]
TemplateDef = var_Chart
Template = [var_Chart.Label(1) = ""]
endwith
// var_Chart.Label(2) = ""
with (oG2antt)
TemplateDef = [dim var_Chart]
TemplateDef = var_Chart
Template = [var_Chart.Label(2) = ""]
endwith
// var_Chart.Label(17) = ""
with (oG2antt)
TemplateDef = [dim var_Chart]
TemplateDef = var_Chart
Template = [var_Chart.Label(17) = ""]
endwith
// var_Chart.Label(65536) = ""
with (oG2antt)
TemplateDef = [dim var_Chart]
TemplateDef = var_Chart
Template = [var_Chart.Label(65536) = ""]
endwith
// var_Chart.Label(1048576) = ""
with (oG2antt)
TemplateDef = [dim var_Chart]
TemplateDef = var_Chart
Template = [var_Chart.Label(1048576) = ""]
endwith
// var_Chart.Label(16777216) = ""
with (oG2antt)
TemplateDef = [dim var_Chart]
TemplateDef = var_Chart
Template = [var_Chart.Label(16777216) = ""]
endwith
var_Chart.OverviewZoomUnit = 64
var_Chart.LevelCount = 2
var_Chart.NonworkingDays = 0
// var_Chart.PaneWidth(false) = 96
with (oG2antt)
TemplateDef = [dim var_Chart]
TemplateDef = var_Chart
Template = [var_Chart.PaneWidth(False) = 96]
endwith
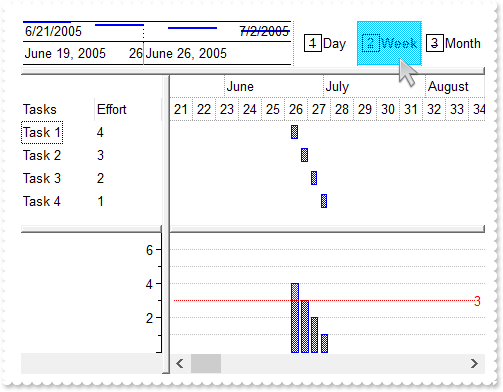
var_Chart.FirstVisibleDate = "06/20/2005"
var_Chart.HistogramVisible = true
var_Chart.HistogramHeight = 128
var_Chart.HistogramView = 112
var_Chart.OverviewVisible = -1
var_Bar = var_Chart.Bars.Item("Task")
var_Bar.HistogramPattern = var_Bar.Pattern
var_Bar.HistogramType = 0
var_Bar.HistogramCriticalValue = 3
var_Bar.HistogramItems = -7
var_Bar.HistogramGridLinesColor = 0xc0c0c0
var_Bar.HistogramRulerLinesColor = 0x10000
var_Items = oG2antt.Items
var_Items.AllowCellValueToItemBar = true
h1 = var_Items.AddItem("Task 1")
var_Items.AddBar(h1,"Task","06/21/2005","06/23/2005")
// var_Items.CellValue(h1,1) = 4
with (oG2antt)
TemplateDef = [dim var_Items,h1]
TemplateDef = var_Items
TemplateDef = h1
Template = [var_Items.CellValue(h1,1) = 4]
endwith
h1 = var_Items.AddItem("Task 2")
var_Items.AddBar(h1,"Task","06/24/2005","06/26/2005")
// var_Items.CellValue(h1,1) = 3
with (oG2antt)
TemplateDef = [dim var_Items,h1]
TemplateDef = var_Items
TemplateDef = h1
Template = [var_Items.CellValue(h1,1) = 3]
endwith
h1 = var_Items.AddItem("Task 3")
var_Items.AddBar(h1,"Task","06/27/2005","06/29/2005")
// var_Items.CellValue(h1,1) = 2
with (oG2antt)
TemplateDef = [dim var_Items,h1]
TemplateDef = var_Items
TemplateDef = h1
Template = [var_Items.CellValue(h1,1) = 2]
endwith
h1 = var_Items.AddItem("Task 4")
var_Items.AddBar(h1,"Task","06/30/2005","07/02/2005")
// var_Items.CellValue(h1,1) = 1
with (oG2antt)
TemplateDef = [dim var_Items,h1]
TemplateDef = var_Items
TemplateDef = h1
Template = [var_Items.CellValue(h1,1) = 1]
endwith
oG2antt.EndUpdate()
|
|
1972
|
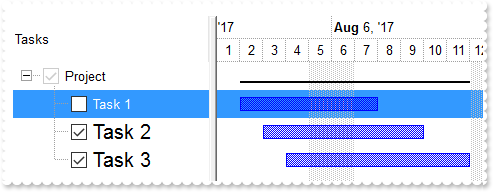
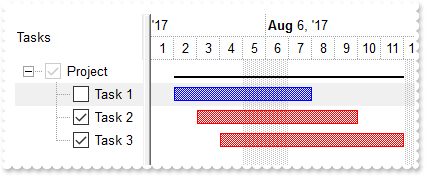
The BeforeExpandItem event is fired when clicking the drop down filter button. What we can do to prevent that
/*
with (this.EXG2ANTTCHARTACTIVEXCONTROL1.nativeObject)
BeforeExpandItem = class::nativeObject_BeforeExpandItem
endwith
*/
// Fired before an item is about to be expanded (collapsed).
function nativeObject_BeforeExpandItem(Item, Cancel)
oG2antt = form.EXG2ANTTCHARTACTIVEXCONTROL1.nativeObject
? "BeforeExpandItem"
? Str(Item)
? "ColumnFromPoint"
? Str(oG2antt.ColumnFromPoint(-1,-1))
? "ColumnFromPoint return -1, if the user clicks the +/- glitch, else it returns the index of the column where the click occurs."
oG2antt.Items.InsertItem(Item,null,"new child")
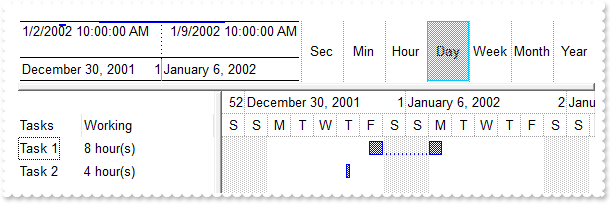
return
local oG2antt,var_Chart,var_Column,var_Columns,var_Items
oG2antt = form.EXG2ANTTCHARTACTIVEXCONTROL1.nativeObject
oG2antt.BeginUpdate()
// oG2antt.Chart.PaneWidth(true) = 0
var_Chart = oG2antt.Chart
with (oG2antt)
TemplateDef = [dim var_Chart]
TemplateDef = var_Chart
Template = [var_Chart.PaneWidth(True) = 0]
endwith
oG2antt.LinesAtRoot = -1
var_Columns = oG2antt.Columns
// var_Columns.Add("Items").DisplayFilterButton = true
var_Column = var_Columns.Add("Items")
with (oG2antt)
TemplateDef = [dim var_Column]
TemplateDef = var_Column
Template = [var_Column.DisplayFilterButton = True]
endwith
var_Items = oG2antt.Items
// var_Items.ItemHasChildren(var_Items.InsertItem(null,null,"Group 1")) = true
with (oG2antt)
TemplateDef = [dim var_Items]
TemplateDef = var_Items
Template = [var_Items.ItemHasChildren(InsertItem(,,"Group 1")) = True]
endwith
// var_Items.ItemHasChildren(var_Items.InsertItem(null,null,"Group 2")) = true
with (oG2antt)
TemplateDef = [dim var_Items]
TemplateDef = var_Items
Template = [var_Items.ItemHasChildren(InsertItem(,,"Group 2")) = True]
endwith
oG2antt.EndUpdate()
|
|
1971
|
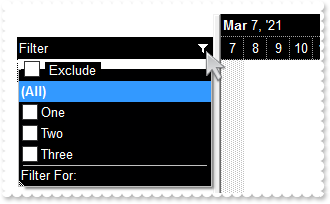
How do I change the drop down filter icon/button (black)
local oG2antt,var_Appearance,var_Chart,var_Column,var_Items

oG2antt = form.EXG2ANTTCHARTACTIVEXCONTROL1.nativeObject
oG2antt.BeginUpdate()
var_Appearance = oG2antt.VisualAppearance
	var_Appearance.Add(1,"gBFLBCJwBAEHhEJAAEhABXUIQAAYAQGKIcBiAKBQAGYBIJDEMgzDDAUBjKKocQTC4AIQjCK4JDKHYJRpHEZyCA8EhqGASRAFUQBYiWE4oSpLABQaK0ZwIGyRIrkGQgQgmPYDSDNU4zVIEEglBI0TDNczhNDENgtGYaJqHIYpZBcM40TKkEZoSIITZcRrOEBiRL1S0RBhGcRUHZlWzdN64LhuK47UrWdD/XhdVzXRbjfz1Oq+bxve48Br7A5yYThdr4LhOFQ3RjIL4xbIcUwGe6VZhjOLZXjmO49T69HTtOCYBEBA")
oG2antt.Template = [Background(32) = -1] // oG2antt.Background(32) = -1
oG2antt.Template = [Background(0) = 16777216] // oG2antt.Background(0) = 0x1000000
oG2antt.Template = [Background(26) = 65536] // oG2antt.Background(26) = 0x10000
oG2antt.Template = [Background(27) = 16777215] // oG2antt.Background(27) = 0xffffff
oG2antt.Template = [Description(25) = "<bgcolor 0><fgcolor ffffff> Exclude </fgcolor></bgcolor>"] // oG2antt.Description(25) = "<bgcolor 0><fgcolor ffffff> Exclude </fgcolor></bgcolor>"
oG2antt.HeaderAppearance = 0
oG2antt.BackColorHeader = 0x0
oG2antt.ForeColorHeader = 0xffffff
oG2antt.HeaderVisible = true
oG2antt.BackColorLevelHeader = oG2antt.BackColor
var_Column = oG2antt.Columns.Add("Filter")
	var_Column.FilterList = 8448 /*exShowExclude | exShowCheckBox*/
	var_Column.DisplayFilterButton = true
	var_Column.AllowSort = false
	var_Column.AllowDragging = false
var_Chart = oG2antt.Chart
	// var_Chart.PaneWidth(false) = 196
	with (oG2antt)
		TemplateDef = [dim var_Chart]
		TemplateDef = var_Chart
		Template = [var_Chart.PaneWidth(False) = 196]
	endwith
	var_Chart.LevelCount = 2
	var_Chart.BackColorLevelHeader = oG2antt.BackColorHeader
	var_Chart.ForeColorLevelHeader = oG2antt.ForeColorHeader
var_Items = oG2antt.Items
	var_Items.AddItem("One")
	var_Items.AddItem("Two")
	var_Items.AddItem("Three")
oG2antt.EndUpdate()
|
|
1970
|
How do I change the z-order of the bars (percent)
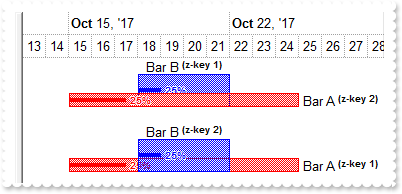
/*
with (this.EXG2ANTTCHARTACTIVEXCONTROL1.nativeObject)
	MouseMove = class::nativeObject_MouseMove
endwith
*/
// Occurs when the user moves the mouse.
function nativeObject_MouseMove(Button, Shift, X, Y)
	local b,i
	oG2antt = form.EXG2ANTTCHARTACTIVEXCONTROL1.nativeObject
	b = oG2antt.Chart.BarFromPoint(-1,-1)
	i = oG2antt.ItemFromPoint(-1,-1,c,hit)
	? Str(oG2antt.Items.ItemBar(i,b,6))
return

local h1,oG2antt,var_Bar,var_Bar1,var_Bar2,var_Chart,var_Items

oG2antt = form.EXG2ANTTCHARTACTIVEXCONTROL1.nativeObject
oG2antt.BeginUpdate()
oG2antt.Columns.Add("Tasks")
oG2antt.DefaultItemHeight = 52
var_Chart = oG2antt.Chart
	var_Chart.LevelCount = 2
	var_Chart.FirstVisibleDate = "10/10/2017"
	// var_Chart.PaneWidth(false) = 0
	with (oG2antt)
		TemplateDef = [dim var_Chart]
		TemplateDef = var_Chart
		Template = [var_Chart.PaneWidth(False) = 0]
	endwith
	var_Chart.NonworkingDays = 0
	var_Chart.MarkTodayColor = var_Chart.BackColor
	// var_Chart.Bars.Add("Task%Progress").Shortcut = "Task"
	var_Bar = var_Chart.Bars.Add("Task%Progress")
	with (oG2antt)
		TemplateDef = [dim var_Bar]
		TemplateDef = var_Bar
		Template = [var_Bar.Shortcut = "Task"]
	endwith
	var_Bar1 = var_Chart.Bars.Copy("Task","T1")
		var_Bar1.Color = 0xff
		// var_Bar1.Def(3) = "<%=%17 + `<b><font ;6><off -4> (z-key `+%9+`)`%>"
		with (oG2antt)
			TemplateDef = [dim var_Bar1]
			TemplateDef = var_Bar1
			Template = [var_Bar1.Def(3) = "<%=%17 + `<b><font ;6><off -4> (z-key `+%9+`)`%>"]
		endwith
		// var_Bar1.Def(4) = 18
		with (oG2antt)
			TemplateDef = [dim var_Bar1]
			TemplateDef = var_Bar1
			Template = [var_Bar1.Def(4) = 18]
		endwith
		// var_Bar1.Def(12) = 0.25
		with (oG2antt)
			TemplateDef = [dim var_Bar1]
			TemplateDef = var_Bar1
			Template = [var_Bar1.Def(12) = 0.25]
		endwith
		// var_Bar1.Def(39) = var_Bar1.Color
		with (oG2antt)
			TemplateDef = [dim var_Bar1]
			TemplateDef = var_Bar1
			Template = [var_Bar1.Def(39) = Color]
		endwith
		// var_Bar1.Def(18) = 10
		with (oG2antt)
			TemplateDef = [dim var_Bar1]
			TemplateDef = var_Bar1
			Template = [var_Bar1.Def(18) = 10]
		endwith
		// var_Bar1.Def(14) = true
		with (oG2antt)
			TemplateDef = [dim var_Bar1]
			TemplateDef = var_Bar1
			Template = [var_Bar1.Def(14) = True]
		endwith
		// var_Bar1.Def(13) = "<font ;6><b>%p%</b>"
		with (oG2antt)
			TemplateDef = [dim var_Bar1]
			TemplateDef = var_Bar1
			Template = [var_Bar1.Def(13) = "<font ;6><b>%p%</b>"]
		endwith
	var_Bar2 = var_Chart.Bars.Copy("Task","T2")
		var_Bar2.Height = 26
		// var_Bar2.Def(3) = "<%=%17 + `<b><font ;6><off -4> (z-key `+%9+`)`%>"
		with (oG2antt)
			TemplateDef = [dim var_Bar2]
			TemplateDef = var_Bar2
			Template = [var_Bar2.Def(3) = "<%=%17 + `<b><font ;6><off -4> (z-key `+%9+`)`%>"]
		endwith
		// var_Bar2.Def(5) = 16
		with (oG2antt)
			TemplateDef = [dim var_Bar2]
			TemplateDef = var_Bar2
			Template = [var_Bar2.Def(5) = 16]
		endwith
		// var_Bar2.Def(12) = 0.25
		with (oG2antt)
			TemplateDef = [dim var_Bar2]
			TemplateDef = var_Bar2
			Template = [var_Bar2.Def(12) = 0.25]
		endwith
		// var_Bar2.Def(39) = var_Bar2.Color
		with (oG2antt)
			TemplateDef = [dim var_Bar2]
			TemplateDef = var_Bar2
			Template = [var_Bar2.Def(39) = Color]
		endwith
		// var_Bar2.Def(14) = true
		with (oG2antt)
			TemplateDef = [dim var_Bar2]
			TemplateDef = var_Bar2
			Template = [var_Bar2.Def(14) = True]
		endwith
		// var_Bar2.Def(13) = "<font ;6><b>%p%</b>"
		with (oG2antt)
			TemplateDef = [dim var_Bar2]
			TemplateDef = var_Bar2
			Template = [var_Bar2.Def(13) = "<font ;6><b>%p%</b>"]
		endwith
var_Items = oG2antt.Items
	h1 = var_Items.AddItem("Task")
	var_Items.AddBar(h1,"T1","10/15/2017","10/25/2017","2")
	// var_Items.ItemBar(h1,"2",17) = "Bar A"
	with (oG2antt)
		TemplateDef = [dim var_Items,h1]
		TemplateDef = var_Items
		TemplateDef = h1
		Template = [var_Items.ItemBar(h1,"2",17) = "Bar A"]
	endwith
	// var_Items.ItemBar(h1,"2",6) = "Bar A <b>Over</b> Bar B"
	with (oG2antt)
		TemplateDef = [dim var_Items,h1]
		TemplateDef = var_Items
		TemplateDef = h1
		Template = [var_Items.ItemBar(h1,"2",6) = "Bar A <b>Over</b> Bar B"]
	endwith
	var_Items.AddBar(h1,"T2","10/18/2017","10/22/2017","1")
	// var_Items.ItemBar(h1,"1",17) = "Bar B"
	with (oG2antt)
		TemplateDef = [dim var_Items,h1]
		TemplateDef = var_Items
		TemplateDef = h1
		Template = [var_Items.ItemBar(h1,"1",17) = "Bar B"]
	endwith
	// var_Items.ItemBar(h1,"1",6) = "Bar B <b>Under</b> Bar A"
	with (oG2antt)
		TemplateDef = [dim var_Items,h1]
		TemplateDef = var_Items
		TemplateDef = h1
		Template = [var_Items.ItemBar(h1,"1",6) = "Bar B <b>Under</b> Bar A"]
	endwith
	h1 = var_Items.AddItem("Task")
	var_Items.AddBar(h1,"T1","10/15/2017","10/25/2017","1")
	// var_Items.ItemBar(h1,"1",17) = "Bar A"
	with (oG2antt)
		TemplateDef = [dim var_Items,h1]
		TemplateDef = var_Items
		TemplateDef = h1
		Template = [var_Items.ItemBar(h1,"1",17) = "Bar A"]
	endwith
	// var_Items.ItemBar(h1,"1",6) = "Bar A <b>Under</b> Bar B"
	with (oG2antt)
		TemplateDef = [dim var_Items,h1]
		TemplateDef = var_Items
		TemplateDef = h1
		Template = [var_Items.ItemBar(h1,"1",6) = "Bar A <b>Under</b> Bar B"]
	endwith
	var_Items.AddBar(h1,"T2","10/18/2017","10/22/2017","2")
	// var_Items.ItemBar(h1,"2",17) = "Bar B"
	with (oG2antt)
		TemplateDef = [dim var_Items,h1]
		TemplateDef = var_Items
		TemplateDef = h1
		Template = [var_Items.ItemBar(h1,"2",17) = "Bar B"]
	endwith
	// var_Items.ItemBar(h1,"2",6) = "Bar B <b>Over</b> Bar A"
	with (oG2antt)
		TemplateDef = [dim var_Items,h1]
		TemplateDef = var_Items
		TemplateDef = h1
		Template = [var_Items.ItemBar(h1,"2",6) = "Bar B <b>Over</b> Bar A"]
	endwith
oG2antt.EndUpdate()
|
|
1969
|
How do I change the z-order of the bars
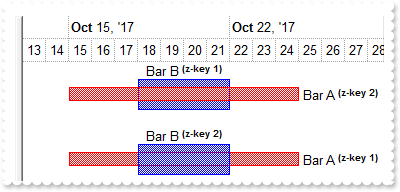
/*
with (this.EXG2ANTTCHARTACTIVEXCONTROL1.nativeObject)
	MouseMove = class::nativeObject_MouseMove
endwith
*/
// Occurs when the user moves the mouse.
function nativeObject_MouseMove(Button, Shift, X, Y)
	local b,i
	oG2antt = form.EXG2ANTTCHARTACTIVEXCONTROL1.nativeObject
	b = oG2antt.Chart.BarFromPoint(-1,-1)
	i = oG2antt.ItemFromPoint(-1,-1,c,hit)
	? Str(oG2antt.Items.ItemBar(i,b,6))
return

local h1,oG2antt,var_Bar,var_Bar1,var_Chart,var_Items

oG2antt = form.EXG2ANTTCHARTACTIVEXCONTROL1.nativeObject
oG2antt.BeginUpdate()
oG2antt.Columns.Add("Tasks")
oG2antt.DefaultItemHeight = 52
var_Chart = oG2antt.Chart
	var_Chart.LevelCount = 2
	var_Chart.FirstVisibleDate = "10/10/2017"
	// var_Chart.PaneWidth(false) = 0
	with (oG2antt)
		TemplateDef = [dim var_Chart]
		TemplateDef = var_Chart
		Template = [var_Chart.PaneWidth(False) = 0]
	endwith
	var_Chart.NonworkingDays = 0
	var_Chart.MarkTodayColor = var_Chart.BackColor
	var_Bar = var_Chart.Bars.Copy("Task","T1")
		var_Bar.Color = 0xff
		// var_Bar.Def(3) = "<%=%17 + `<b><font ;6><off -4> (z-key `+%9+`)`%>"
		with (oG2antt)
			TemplateDef = [dim var_Bar]
			TemplateDef = var_Bar
			Template = [var_Bar.Def(3) = "<%=%17 + `<b><font ;6><off -4> (z-key `+%9+`)`%>"]
		endwith
		// var_Bar.Def(4) = 18
		with (oG2antt)
			TemplateDef = [dim var_Bar]
			TemplateDef = var_Bar
			Template = [var_Bar.Def(4) = 18]
		endwith
	var_Bar1 = var_Chart.Bars.Copy("Task","T2")
		var_Bar1.Height = 25
		// var_Bar1.Def(3) = "<%=%17 + `<b><font ;6><off -4> (z-key `+%9+`)`%>"
		with (oG2antt)
			TemplateDef = [dim var_Bar1]
			TemplateDef = var_Bar1
			Template = [var_Bar1.Def(3) = "<%=%17 + `<b><font ;6><off -4> (z-key `+%9+`)`%>"]
		endwith
		// var_Bar1.Def(5) = 16
		with (oG2antt)
			TemplateDef = [dim var_Bar1]
			TemplateDef = var_Bar1
			Template = [var_Bar1.Def(5) = 16]
		endwith
var_Items = oG2antt.Items
	h1 = var_Items.AddItem("Task")
	var_Items.AddBar(h1,"T1","10/15/2017","10/25/2017","2")
	// var_Items.ItemBar(h1,"2",17) = "Bar A"
	with (oG2antt)
		TemplateDef = [dim var_Items,h1]
		TemplateDef = var_Items
		TemplateDef = h1
		Template = [var_Items.ItemBar(h1,"2",17) = "Bar A"]
	endwith
	// var_Items.ItemBar(h1,"2",6) = "Bar A <b>Over</b> Bar B"
	with (oG2antt)
		TemplateDef = [dim var_Items,h1]
		TemplateDef = var_Items
		TemplateDef = h1
		Template = [var_Items.ItemBar(h1,"2",6) = "Bar A <b>Over</b> Bar B"]
	endwith
	var_Items.AddBar(h1,"T2","10/18/2017","10/22/2017","1")
	// var_Items.ItemBar(h1,"1",17) = "Bar B"
	with (oG2antt)
		TemplateDef = [dim var_Items,h1]
		TemplateDef = var_Items
		TemplateDef = h1
		Template = [var_Items.ItemBar(h1,"1",17) = "Bar B"]
	endwith
	// var_Items.ItemBar(h1,"1",6) = "Bar B <b>Under</b> Bar A"
	with (oG2antt)
		TemplateDef = [dim var_Items,h1]
		TemplateDef = var_Items
		TemplateDef = h1
		Template = [var_Items.ItemBar(h1,"1",6) = "Bar B <b>Under</b> Bar A"]
	endwith
	h1 = var_Items.AddItem("Task")
	var_Items.AddBar(h1,"T1","10/15/2017","10/25/2017","1")
	// var_Items.ItemBar(h1,"1",17) = "Bar A"
	with (oG2antt)
		TemplateDef = [dim var_Items,h1]
		TemplateDef = var_Items
		TemplateDef = h1
		Template = [var_Items.ItemBar(h1,"1",17) = "Bar A"]
	endwith
	// var_Items.ItemBar(h1,"1",6) = "Bar A <b>Under</b> Bar B"
	with (oG2antt)
		TemplateDef = [dim var_Items,h1]
		TemplateDef = var_Items
		TemplateDef = h1
		Template = [var_Items.ItemBar(h1,"1",6) = "Bar A <b>Under</b> Bar B"]
	endwith
	var_Items.AddBar(h1,"T2","10/18/2017","10/22/2017","2")
	// var_Items.ItemBar(h1,"2",17) = "Bar B"
	with (oG2antt)
		TemplateDef = [dim var_Items,h1]
		TemplateDef = var_Items
		TemplateDef = h1
		Template = [var_Items.ItemBar(h1,"2",17) = "Bar B"]
	endwith
	// var_Items.ItemBar(h1,"2",6) = "Bar B <b>Over</b> Bar A"
	with (oG2antt)
		TemplateDef = [dim var_Items,h1]
		TemplateDef = var_Items
		TemplateDef = h1
		Template = [var_Items.ItemBar(h1,"2",6) = "Bar B <b>Over</b> Bar A"]
	endwith
oG2antt.EndUpdate()
|
|
1968
|
How do I get the duration/working count of the bar (sample 6,excrd)
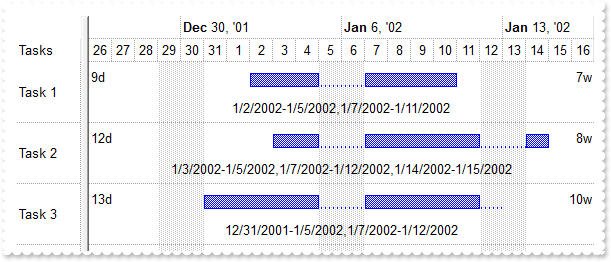
local oG2antt,var_Bar,var_Chart,var_Column,var_Column1,var_Column2,var_Items

oG2antt = form.EXG2ANTTCHARTACTIVEXCONTROL1.nativeObject
oG2antt.BeginUpdate()
oG2antt.DefaultItemHeight = 48
oG2antt.ShowFocusRect = false
oG2antt.SelBackMode = 1
oG2antt.BackColorLevelHeader = oG2antt.BackColor
oG2antt.DrawGridLines = -1
var_Chart = oG2antt.Chart
	var_Chart.DrawGridLines = 1
	// var_Chart.PaneWidth(false) = 64
	with (oG2antt)
		TemplateDef = [dim var_Chart]
		TemplateDef = var_Chart
		Template = [var_Chart.PaneWidth(False) = 64]
	endwith
	var_Chart.LevelCount = 2
	var_Chart.FirstVisibleDate = "12/26/2001"
	var_Bar = var_Chart.Bars.Add("Task:Split")
		var_Bar.Shortcut = "Task"
		// var_Bar.Def(6) = "<%=%263%>"
		with (oG2antt)
			TemplateDef = [dim var_Bar]
			TemplateDef = var_Bar
			Template = [var_Bar.Def(6) = "<%=%263%>"]
		endwith
		// var_Bar.Def(18) = -12
		with (oG2antt)
			TemplateDef = [dim var_Bar]
			TemplateDef = var_Bar
			Template = [var_Bar.Def(18) = -12]
		endwith
	var_Chart.ColumnsFormatLevel = "1,2/3"
oG2antt.Columns.Add("Tasks")
var_Column = oG2antt.Columns.Add("Duration")
	// var_Column.Def(18) = 513
	with (oG2antt)
		TemplateDef = [dim var_Column]
		TemplateDef = var_Column
		Template = [var_Column.Def(18) = 513]
	endwith
	var_Column.Visible = false
	var_Column.Alignment = 0
	var_Column.FormatColumn = "value + `d`"
var_Column1 = oG2antt.Columns.Add("Working")
	// var_Column1.Def(18) = 258
	with (oG2antt)
		TemplateDef = [dim var_Column1]
		TemplateDef = var_Column1
		Template = [var_Column1.Def(18) = 258]
	endwith
	var_Column1.Visible = false
	var_Column1.Alignment = 2
	var_Column1.FormatColumn = "value + `w`"
var_Column2 = oG2antt.Columns.Add("Working-Period")
	// var_Column2.Def(18) = 263
	with (oG2antt)
		TemplateDef = [dim var_Column2]
		TemplateDef = var_Column2
		Template = [var_Column2.Def(18) = 263]
	endwith
	var_Column2.Visible = false
	var_Column2.Alignment = 1
	var_Column2.FormatColumn = "((value replace `\r\n` with `,`) replace `#` with ``) replace ` ` with ``"
var_Items = oG2antt.Items
	var_Items.AllowCellValueToItemBar = true
	var_Items.AddBar(var_Items.AddItem("Task 1"),"Task","01/02/2002","01/11/2002")
	var_Items.AddBar(var_Items.AddItem("Task 2"),"Task","01/03/2002","01/15/2002")
	var_Items.AddBar(var_Items.AddItem("Task 3"),"Task","12/31/2001","01/13/2002")
oG2antt.EndUpdate()
|
|
1967
|
How do I get the duration/working count of the bar (sample 5)
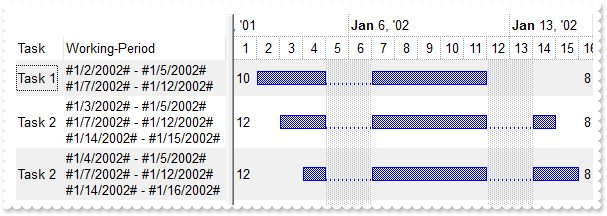
/*
with (this.EXG2ANTTCHARTACTIVEXCONTROL1.nativeObject)
	AddItem = class::nativeObject_AddItem
endwith
*/
// Occurs after a new Item has been inserted to Items collection.
function nativeObject_AddItem(Item)
	local var_Items
	oG2antt = form.EXG2ANTTCHARTACTIVEXCONTROL1.nativeObject
	var_Items = oG2antt.Items
		// var_Items.ItemMaxHeight(Item) = 64
		with (oG2antt)
			TemplateDef = [dim var_Items,Item]
			TemplateDef = var_Items
			TemplateDef = Item
			Template = [var_Items.ItemMaxHeight(Item) = 64]
		endwith
return

local oG2antt,var_Bar,var_Chart,var_Column,var_Column1,var_Column2,var_Column3,var_Items

oG2antt = form.EXG2ANTTCHARTACTIVEXCONTROL1.nativeObject
oG2antt.BeginUpdate()
oG2antt.BackColorAlternate = 0xf0f0f0
var_Chart = oG2antt.Chart
	// var_Chart.PaneWidth(false) = 256
	with (oG2antt)
		TemplateDef = [dim var_Chart]
		TemplateDef = var_Chart
		Template = [var_Chart.PaneWidth(False) = 256]
	endwith
	var_Chart.LevelCount = 2
	var_Chart.FirstVisibleDate = "01/01/2002"
	var_Bar = var_Chart.Bars.Add("Task:Split")
		var_Bar.Shortcut = "Task"
		// var_Bar.Def(6) = "<%=%263%>"
		with (oG2antt)
			TemplateDef = [dim var_Bar]
			TemplateDef = var_Bar
			Template = [var_Bar.Def(6) = "<%=%263%>"]
		endwith
	var_Chart.ColumnsFormatLevel = "1,2"
	var_Chart.SelBackColor = oG2antt.SelBackColor
var_Column = oG2antt.Columns.Add("Task")
	var_Column.AllowSizing = false
	var_Column.Width = 48
var_Column1 = oG2antt.Columns.Add("Duration")
	// var_Column1.Def(18) = 513
	with (oG2antt)
		TemplateDef = [dim var_Column1]
		TemplateDef = var_Column1
		Template = [var_Column1.Def(18) = 513]
	endwith
	var_Column1.Visible = false
	var_Column1.Alignment = 0
var_Column2 = oG2antt.Columns.Add("Working")
	// var_Column2.Def(18) = 258
	with (oG2antt)
		TemplateDef = [dim var_Column2]
		TemplateDef = var_Column2
		Template = [var_Column2.Def(18) = 258]
	endwith
	var_Column2.Visible = false
	var_Column2.Alignment = 2
var_Column3 = oG2antt.Columns.Add("Working-Period")
	// var_Column3.Def(18) = 263
	with (oG2antt)
		TemplateDef = [dim var_Column3]
		TemplateDef = var_Column3
		Template = [var_Column3.Def(18) = 263]
	endwith
	// var_Column3.Def(16) = false
	with (oG2antt)
		TemplateDef = [dim var_Column3]
		TemplateDef = var_Column3
		Template = [var_Column3.Def(16) = False]
	endwith
var_Items = oG2antt.Items
	var_Items.AllowCellValueToItemBar = true
	var_Items.AddBar(var_Items.AddItem("Task 1"),"Task","01/02/2002","01/12/2002")
	var_Items.AddBar(var_Items.AddItem("Task 2"),"Task","01/03/2002","01/15/2002")
	var_Items.AddBar(var_Items.AddItem("Task 2"),"Task","01/04/2002","01/16/2002")
oG2antt.EndUpdate()
|
|
1966
|
How do I get the duration/working count of the bar (sample 4)
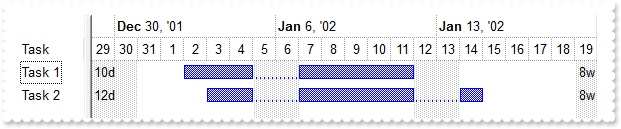
local oG2antt,var_Bar,var_Chart,var_Column,var_Column1,var_Column2,var_Items

oG2antt = form.EXG2ANTTCHARTACTIVEXCONTROL1.nativeObject
oG2antt.BeginUpdate()
var_Chart = oG2antt.Chart
	// var_Chart.PaneWidth(false) = 64
	with (oG2antt)
		TemplateDef = [dim var_Chart]
		TemplateDef = var_Chart
		Template = [var_Chart.PaneWidth(False) = 64]
	endwith
	var_Chart.LevelCount = 2
	var_Chart.FirstVisibleDate = "12/26/2001"
	// var_Chart.Bars.Add("Task:Split").Shortcut = "Task"
	var_Bar = var_Chart.Bars.Add("Task:Split")
	with (oG2antt)
		TemplateDef = [dim var_Bar]
		TemplateDef = var_Bar
		Template = [var_Bar.Shortcut = "Task"]
	endwith
	var_Chart.ColumnsFormatLevel = "1,2"
// oG2antt.Columns.Add("Task").Width = 48
var_Column = oG2antt.Columns.Add("Task")
with (oG2antt)
	TemplateDef = [dim var_Column]
	TemplateDef = var_Column
	Template = [var_Column.Width = 48]
endwith
var_Column1 = oG2antt.Columns.Add("Duration")
	// var_Column1.Def(18) = 513
	with (oG2antt)
		TemplateDef = [dim var_Column1]
		TemplateDef = var_Column1
		Template = [var_Column1.Def(18) = 513]
	endwith
	var_Column1.Visible = false
	var_Column1.Alignment = 0
	var_Column1.FormatColumn = "value + `d`"
var_Column2 = oG2antt.Columns.Add("Working")
	// var_Column2.Def(18) = 258
	with (oG2antt)
		TemplateDef = [dim var_Column2]
		TemplateDef = var_Column2
		Template = [var_Column2.Def(18) = 258]
	endwith
	var_Column2.Visible = false
	var_Column2.Alignment = 2
	var_Column2.FormatColumn = "value + `w`"
var_Items = oG2antt.Items
	var_Items.AllowCellValueToItemBar = true
	var_Items.AddBar(var_Items.AddItem("Task 1"),"Task","01/02/2002","01/12/2002")
	var_Items.AddBar(var_Items.AddItem("Task 2"),"Task","01/03/2002","01/15/2002")
oG2antt.EndUpdate()
|
|
1965
|
How do I get the duration/working count of the bar (sample 3)
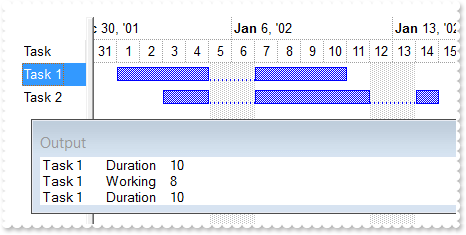
/*
with (this.EXG2ANTTCHARTACTIVEXCONTROL1.nativeObject)
	BarResizing = class::nativeObject_BarResizing
endwith
*/
// Occurs when a bar is moving or resizing.
function nativeObject_BarResizing(Item, Key)
	local var_Items
	oG2antt = form.EXG2ANTTCHARTACTIVEXCONTROL1.nativeObject
	var_Items = oG2antt.Items
		? var_Items.CellCaption(Item,0)
		? "Working"
		? Str(var_Items.ItemBar(Item,Key,258))
		? var_Items.CellCaption(Item,0)
		? "Duration"
		? Str(var_Items.ItemBar(Item,Key,513))
return

local oG2antt,var_Bar,var_Chart,var_Column,var_Items

oG2antt = form.EXG2ANTTCHARTACTIVEXCONTROL1.nativeObject
oG2antt.BeginUpdate()
var_Chart = oG2antt.Chart
	// var_Chart.PaneWidth(false) = 64
	with (oG2antt)
		TemplateDef = [dim var_Chart]
		TemplateDef = var_Chart
		Template = [var_Chart.PaneWidth(False) = 64]
	endwith
	var_Chart.LevelCount = 2
	var_Chart.FirstVisibleDate = "12/26/2001"
	// var_Chart.Bars.Add("Task:Split").Shortcut = "Task"
	var_Bar = var_Chart.Bars.Add("Task:Split")
	with (oG2antt)
		TemplateDef = [dim var_Bar]
		TemplateDef = var_Bar
		Template = [var_Bar.Shortcut = "Task"]
	endwith
// oG2antt.Columns.Add("Task").Width = 48
var_Column = oG2antt.Columns.Add("Task")
with (oG2antt)
	TemplateDef = [dim var_Column]
	TemplateDef = var_Column
	Template = [var_Column.Width = 48]
endwith
var_Items = oG2antt.Items
	var_Items.AddBar(var_Items.AddItem("Task 1"),"Task","01/02/2002","01/12/2002")
	var_Items.AddBar(var_Items.AddItem("Task 2"),"Task","01/03/2002","01/15/2002")
oG2antt.EndUpdate()
|
|
1964
|
How do I get the duration/working count of the bar (sample 2)
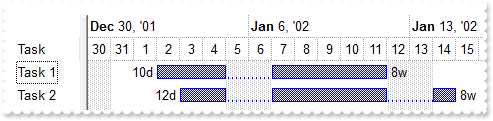
local oG2antt,var_Bar,var_Chart,var_Column,var_Items

oG2antt = form.EXG2ANTTCHARTACTIVEXCONTROL1.nativeObject
oG2antt.BeginUpdate()
var_Chart = oG2antt.Chart
	// var_Chart.PaneWidth(false) = 64
	with (oG2antt)
		TemplateDef = [dim var_Chart]
		TemplateDef = var_Chart
		Template = [var_Chart.PaneWidth(False) = 64]
	endwith
	var_Chart.LevelCount = 2
	var_Chart.FirstVisibleDate = "12/26/2001"
	var_Bar = var_Chart.Bars.Add("Task:Split")
		var_Bar.Shortcut = "Task"
		// var_Bar.Def(3) = "<%=%258%>w"
		with (oG2antt)
			TemplateDef = [dim var_Bar]
			TemplateDef = var_Bar
			Template = [var_Bar.Def(3) = "<%=%258%>w"]
		endwith
		// var_Bar.Def(4) = 18
		with (oG2antt)
			TemplateDef = [dim var_Bar]
			TemplateDef = var_Bar
			Template = [var_Bar.Def(4) = 18]
		endwith
		// var_Bar.Def(44) = "<%=%513%>d"
		with (oG2antt)
			TemplateDef = [dim var_Bar]
			TemplateDef = var_Bar
			Template = [var_Bar.Def(44) = "<%=%513%>d"]
		endwith
		// var_Bar.Def(45) = 16
		with (oG2antt)
			TemplateDef = [dim var_Bar]
			TemplateDef = var_Bar
			Template = [var_Bar.Def(45) = 16]
		endwith
// oG2antt.Columns.Add("Task").Width = 48
var_Column = oG2antt.Columns.Add("Task")
with (oG2antt)
	TemplateDef = [dim var_Column]
	TemplateDef = var_Column
	Template = [var_Column.Width = 48]
endwith
var_Items = oG2antt.Items
	var_Items.AddBar(var_Items.AddItem("Task 1"),"Task","01/02/2002","01/12/2002")
	var_Items.AddBar(var_Items.AddItem("Task 2"),"Task","01/03/2002","01/15/2002")
oG2antt.EndUpdate()
|
|
1963
|
How do I get the duration/working count of the bar (sample 1)
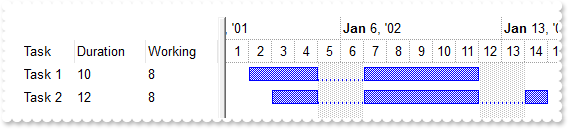
local oG2antt,var_Bar,var_Chart,var_Column,var_Column1,var_Column2,var_Items

oG2antt = form.EXG2ANTTCHARTACTIVEXCONTROL1.nativeObject
oG2antt.BeginUpdate()
var_Chart = oG2antt.Chart
	// var_Chart.PaneWidth(false) = 196
	with (oG2antt)
		TemplateDef = [dim var_Chart]
		TemplateDef = var_Chart
		Template = [var_Chart.PaneWidth(False) = 196]
	endwith
	var_Chart.LevelCount = 2
	var_Chart.FirstVisibleDate = "01/01/2002"
	// var_Chart.Bars.Add("Task:Split").Shortcut = "Task"
	var_Bar = var_Chart.Bars.Add("Task:Split")
	with (oG2antt)
		TemplateDef = [dim var_Bar]
		TemplateDef = var_Bar
		Template = [var_Bar.Shortcut = "Task"]
	endwith
// oG2antt.Columns.Add("Task").Width = 48
var_Column = oG2antt.Columns.Add("Task")
with (oG2antt)
	TemplateDef = [dim var_Column]
	TemplateDef = var_Column
	Template = [var_Column.Width = 48]
endwith
// oG2antt.Columns.Add("Duration").Def(18) = 513
var_Column1 = oG2antt.Columns.Add("Duration")
with (oG2antt)
	TemplateDef = [dim var_Column1]
	TemplateDef = var_Column1
	Template = [var_Column1.Def(18) = 513]
endwith
// oG2antt.Columns.Add("Working").Def(18) = 258
var_Column2 = oG2antt.Columns.Add("Working")
with (oG2antt)
	TemplateDef = [dim var_Column2]
	TemplateDef = var_Column2
	Template = [var_Column2.Def(18) = 258]
endwith
var_Items = oG2antt.Items
	var_Items.AllowCellValueToItemBar = true
	var_Items.AddBar(var_Items.AddItem("Task 1"),"Task","01/02/2002","01/12/2002")
	var_Items.AddBar(var_Items.AddItem("Task 2"),"Task","01/03/2002","01/15/2002")
oG2antt.EndUpdate()
|
|
1962
|
How can I draw a solid frame around the the focusing item
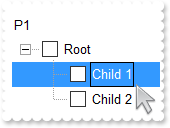
local h,oG2antt,var_Appearance,var_Chart,var_Column,var_Items

oG2antt = form.EXG2ANTTCHARTACTIVEXCONTROL1.nativeObject
oG2antt.BeginUpdate()
oG2antt.SingleSel = false
oG2antt.DefaultItemHeight = 20
var_Appearance = oG2antt.VisualAppearance
	var_Appearance.RenderType = -1
	var_Appearance.Add(1,"gBFLBCJwBAEHhEJAAEhABOkGACAADACAxRDgMQBQKAAzAJBIYhkGYYYCgMZRUDGCYXABCEYRXBKUQSDqEYyjGLIXAWCYSAAMIwDKAUEwpFAZBhgeDYMiSNoYDJCM4wHIURRJFCUJSGWQpTgSIgyT5HFIxXKoASbJabZLhWS6EpWOotTbIQQRYCkEyfKKfZyGURZQqOKA1DBZErWTJESRFJqLazgO4LAhyQYrVgAErzVKVCRNOqbJzADApdpGQJTULDNTQHRFIyhOSnIRrWbMAhid6JUZiVT4dBOIYhSYANAqCwLFqrDJmWrpV5WZjlZ47V6BdAyXJsIrmFJEXaOGhyDDlGybSDZYryfZhUziUw4XjbWwZDqPF6DKTTdSGLREE8WZVlURZvDaep3C+AY8kAYRgGCCBJECUhjDoHROEYWgoAGTQ1CEEx9lGMY0CQUYSnuZQDBGBYFlOH5+H+igGAKAJgEgFgGgGVgDn4CoCmCSA2A6A5hAgDgQgSYRIE4EoFGGCBiBeBhhkgPgbgcYgICoH4IGGWIOCSBhiGiHgVgoYooFoAoLGIWI+DCCgjCiTgrgII4ImYOoOmOSJ2AYOpWlQDQBICA=")
oG2antt.ShowFocusRect = true
oG2antt.Template = [Background(19) = 16777216] // oG2antt.Background(19) = 0x1000000
oG2antt.LinesAtRoot = -1
// oG2antt.Chart.PaneWidth(true) = 1
var_Chart = oG2antt.Chart
with (oG2antt)
	TemplateDef = [dim var_Chart]
	TemplateDef = var_Chart
	Template = [var_Chart.PaneWidth(True) = 1]
endwith
var_Column = oG2antt.Columns.Add("P1")
	// var_Column.Def(0) = true
	with (oG2antt)
		TemplateDef = [dim var_Column]
		TemplateDef = var_Column
		Template = [var_Column.Def(0) = True]
	endwith
	var_Column.PartialCheck = true
var_Items = oG2antt.Items
	h = var_Items.AddItem("Root")
	var_Items.InsertItem(h,null,"Child 1")
	var_Items.InsertItem(h,null,"Child 2")
	// var_Items.ExpandItem(h) = true
	with (oG2antt)
		TemplateDef = [dim var_Items,h]
		TemplateDef = var_Items
		TemplateDef = h
		Template = [var_Items.ExpandItem(h) = True]
	endwith
oG2antt.EndUpdate()
|
|
1961
|
The frame around the focusing item is not very clear. Can I show it larger or more cleared (sample 2)
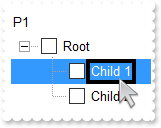
local h,oG2antt,var_Appearance,var_Chart,var_Column,var_Items

oG2antt = form.EXG2ANTTCHARTACTIVEXCONTROL1.nativeObject
oG2antt.BeginUpdate()
oG2antt.SingleSel = false
oG2antt.DefaultItemHeight = 20
oG2antt.ShowFocusRect = true
var_Appearance = oG2antt.VisualAppearance
	var_Appearance.RenderType = -1
	var_Appearance.Add(2,"gBFLBCJwBAEHhEJAAEhABPEGACAADACAxRDgMQBQKAAzAJBIYhkGYYYCgMZRUDGCYXABCEYRXBKUQSDqEYyjGLIXAWCYSAAMIwDKAUEwpFAZBhgeCRUgyJI3RgMUIzVAcRRFEiUJQlIZZCjOAw0SIMU7xZRcNxsACnaZnCR4NiuRYiUhOcqzRIQIQ4CiEahqOgJbDUJYwWZKAyjBY8XTZFCSJCpeJ6egOc5jRxQUp1WAEXx3GSsJKvCZ5cADBY+VLQNS0JBtMSTKSLaiuWoIJqCPaDRheWKQJh1NSnLqEcjyYANDxDCZlWzAYxWTZ2Uz7N7PbB0HY4DyPGKZYrfESVRbQcZNS6nNigPI9XhfGq6VjRe63ZaOaYpWrnOJqTRWjOKYujWdZ2BGO5lkuBAAkmcQkDmDBEAwEQJCgGhMGcQ4pkiSxGAAOYmkQIhvkYNg2gSCgyj+LI4GIMIwF2XQoAYAoAmASAWAaAZgggJgKFiT54DYDoDmECBGBKBJgGgTgWgWYRoFYGIGmGOBqByB5hCgegggiYJYgoJIICIaIeByChiigYgsgsYYYBYMIKCMKJOCuDRjGiOgLg6Y5InYPoPmQCAkmsXAQDQBCAg=")
	var_Appearance.Add(3,"CP:2 -3 0 3 0")
oG2antt.Template = [Background(19) = 50397441] // oG2antt.Background(19) = 0x3010101
oG2antt.LinesAtRoot = -1
// oG2antt.Chart.PaneWidth(true) = 1
var_Chart = oG2antt.Chart
with (oG2antt)
	TemplateDef = [dim var_Chart]
	TemplateDef = var_Chart
	Template = [var_Chart.PaneWidth(True) = 1]
endwith
var_Column = oG2antt.Columns.Add("P1")
	// var_Column.Def(0) = true
	with (oG2antt)
		TemplateDef = [dim var_Column]
		TemplateDef = var_Column
		Template = [var_Column.Def(0) = True]
	endwith
	var_Column.PartialCheck = true
var_Items = oG2antt.Items
	h = var_Items.AddItem("Root")
	var_Items.InsertItem(h,null,"Child 1")
	var_Items.InsertItem(h,null,"Child 2")
	// var_Items.ExpandItem(h) = true
	with (oG2antt)
		TemplateDef = [dim var_Items,h]
		TemplateDef = var_Items
		TemplateDef = h
		Template = [var_Items.ExpandItem(h) = True]
	endwith
oG2antt.EndUpdate()
|
|
1960
|
The frame around the focusing item is not very clear. Can I show it larger or more cleared (sample 1)
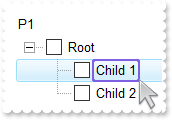
local h,oG2antt,var_Appearance,var_Chart,var_Column,var_Items

oG2antt = form.EXG2ANTTCHARTACTIVEXCONTROL1.nativeObject
oG2antt.BeginUpdate()
oG2antt.SingleSel = false
oG2antt.ShowFocusRect = true
var_Appearance = oG2antt.VisualAppearance
	var_Appearance.Add(1,"gBFLBCJwBAEHhEJAAEhABHoDg6AADACAxRDgMQBQKAAzAJBIYhkGYYYCgMZRUDGCYXABCEYRXBIZQ7BKNIxjSJwFiCCQwSDKEjyCKcGRHF6MI6gOYpCgOIYjRJNIASVAceAAGaUZrjSgobjmOYhAJCLqhYIgASXJqLaBlOCaAieSc+QhjQJIJoeCZXU5TFg1BTsOhqEqcRiseaRVDCaIJWzbdYWLDdNQHHKYLjnWorbpSJZ5XjNEySDQkMS9PrEJ7vST8FBCdAABLJUB2BR9RwxRafKpnWwJDpmCaOQLXEB5DK1PyVMTKYrtGy7GrIAJxWxbV4UHh+QABOzIMAvHKJMwvHYcUZne5XVLeF41HbONogPaJZyIAK2cLROq6Xo7GEcJZEcLASB4DwvgWUZlE6AQQhKAYkkYdA6hyDIwHgSoqFwQgmnsYxjGgSIiBOTpSEiAwRgOJI7j4JAHA6U5wm0MpPlOBIjD8TZiGYCICiCGAuA6AxhAgMgSgOYQ4DYBg/g6cw1n+ABOmMMJ9DmCwjnScw4RsVJngkYh4hoKIKmKKI2CmC5ikiQgqgiT5jhyMw8g4QwIn0OIKEiCJhD8DwTGyfA7k0WQOEWEQkGkJhIhKZB5DYSoTiSCQEn4PQOCOXJcCeIJjliaIQk0aRyF4O5llmAhfhgZhJg4ZoYiaAxYn4PZOhOZJaCUZYTiYQw1mcOZUm+HQnHmWh4h6Z4pnYeYfk0eYsmqG4nAgNJ2DqD5DkCWoiGiOgqgyI5omoR" ;
	 +"oNiSaQKFKEojCaM4ugSFhOjkAJcieKgDkaH4oioGoOiaKRqgqEoqDddwyhuAxPgOMJ8DyDZqk6NYtCsapmjiLprHqdo6i+K5K1oPhOlqPgKD4DpjnII4yiOewuk6MxtAsMpSjObQ7EaT4wk6ewYn0PgPAiCJkjeLgDk6X44i4G4OmaORuguEpqDkLAzkaWg+E8GIUmaPIvEOVpzj2Lxbl6eo+G+S5in4OYPmOaJyjuTwjnYWpBg6DAjAqQZwkwJwNkKcJsEcEJCDBEpaD6Dw8BiapGjGSgfB2RpxmyBwgkicZ8haBw/g+M5TBcPQPlOXJskscp8jsMJMnMLJXDGTZzEyYw2kwMoDlcFw9i2M4/EGUJPg0CxFlENBtCcSJSnQfQ0m+SgPHsaJ7lALZLG6XZVHWDRfFqVY1k0ZxdladYTnifJUGaeAWAeMnSGcGWgBObJ3lWbwdjKW5cHcTZPHaLkN4GxXDlFqFsA4uRbBOGAFAEIzAsDEFOBkfYqR4D6AOBEYo8QuBvAmMceInBDgcD0JwOIqQyJ1DMAwG4IANDnHSMoK4QhOgMBGNEIQvQWAdGenETIswGiddsAAQAgCAgA==")
	var_Appearance.Add(2,"gBFLBCJwBAEHhEJAAEhABeEGACAADACAxRDgMQBQKAAzAJBIYhkGYYYCgMZRUDGCYXABCEYRXBIZQ7BKNIxjSJwFgmEgADDFIBQSLAYROGSDJBGODJDjWGIeQLOEhQHIMRxPE6UYLhWYpBDKPYcUbGc7yBBMVwGf59XzACoKSheQIVSDQkw6Fo6NYhAxHALyNRkBy8f60KjtGpodDUJYvW5JYyjBZ8EznOqbJBkeJ7BgOe5NQjaD72VgdWQJFSWJajWYYJDOJY2ZAAE5TVINEwxJbDaylChIdxaF6WAzZEBhBYoATPNLBMrhWqKDw2XaQWBCOgwHYeR5LU7BdRwbIrRq2eAAXbcVyXfDddZlBK+QA0SK9lRVTKvJZmKgBWw1COSxmAAGw4kcNx1iKFBiCAfQsG8lJemucg7nsXpUHOOxrm+DI3jOH4XAOBx2nscw0j2HhPG4L5uGEVIECQCBCEUAYkGMHQHFGSBlGaAxkEgQgTGCVBsDYQhCgQJZrHKUggGEShkFGNgIlsNpPnMHJHD+TADAIJIJiIWIeCqChikiIgmgiD5zHyXxgiACJKCuC4jHiZgtg6I4IlkCQwkwOIonMPJjEkFhGhGZBpA4KoMBCGJuEiE5lAkGg7hMY4JEYVoUCUNAOE6FZl0KWQACWOR2GKF5mBmChchkJRZhoXYaCKKYqGuDglEmNhuhWZpIiYc4dCcCRqGmHZlgm2YxAwSQKESHwkFkKgpiAIAIH4PIimOOg2DiChoiQJRRD+T" ;
	 +"ZDHCfwyAyCgyg+JpiioYJ/DgDgIlECQ6lwRAEICA=")
	var_Appearance.Add(3,"CP:2 -2 0 2 0")
oG2antt.SelBackColor = 0x1000000
oG2antt.SelForeColor = 0x0
// oG2antt.Chart.PaneWidth(true) = 1
var_Chart = oG2antt.Chart
with (oG2antt)
	TemplateDef = [dim var_Chart]
	TemplateDef = var_Chart
	Template = [var_Chart.PaneWidth(True) = 1]
endwith
oG2antt.Template = [Background(19) = 67043328] // oG2antt.Background(19) = 0x3ff0000
oG2antt.LinesAtRoot = -1
var_Column = oG2antt.Columns.Add("P1")
	// var_Column.Def(0) = true
	with (oG2antt)
		TemplateDef = [dim var_Column]
		TemplateDef = var_Column
		Template = [var_Column.Def(0) = True]
	endwith
	var_Column.PartialCheck = true
var_Items = oG2antt.Items
	h = var_Items.AddItem("Root")
	var_Items.InsertItem(h,null,"Child 1")
	var_Items.InsertItem(h,null,"Child 2")
	// var_Items.ExpandItem(h) = true
	with (oG2antt)
		TemplateDef = [dim var_Items,h]
		TemplateDef = var_Items
		TemplateDef = h
		Template = [var_Items.ExpandItem(h) = True]
	endwith
oG2antt.EndUpdate()
|
|
1959
|
How can I display the start/end margins of bars, when cursor hovers it like a tooltip
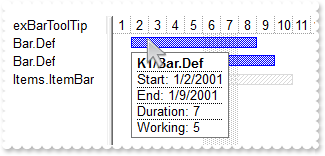
local h,oG2antt,var_Bars,var_Chart,var_Items

oG2antt = form.EXG2ANTTCHARTACTIVEXCONTROL1.nativeObject
oG2antt.BeginUpdate()
oG2antt.Columns.Add("exBarToolTip")
var_Chart = oG2antt.Chart
	// var_Chart.PaneWidth(false) = 96
	with (oG2antt)
		TemplateDef = [dim var_Chart]
		TemplateDef = var_Chart
		Template = [var_Chart.PaneWidth(False) = 96]
	endwith
	var_Chart.FirstVisibleDate = "01/01/2001"
	// var_Chart.Bars.Item("Task").Def(6) = "<b><%=%9 + '/' + %C0%></b><br><upline><dotline>Start: <%=%1%><br>End: <%=%2%><br>Duration: <%=(%2-%1)%><br>Working: <%=%258%>"
	var_Bars = var_Chart.Bars.Item("Task")
	with (oG2antt)
		TemplateDef = [dim var_Bars]
		TemplateDef = var_Bars
		Template = [var_Bars.Def(6) = "<b><%=%9 + '/' + %C0%></b><br><upline><dotline>Start: <%=%1%><br>End: <%=%2%><br>Duration: <%=(%2-%1)%><br>Working: <%=%258%>"]
	endwith
var_Items = oG2antt.Items
	var_Items.AddBar(var_Items.AddItem("Bar.Def"),"Task","01/02/2001","01/09/2001","K1")
	var_Items.AddBar(var_Items.AddItem("Bar.Def"),"Task","01/03/2001","01/10/2001","K1")
	h = var_Items.AddItem("Items.ItemBar")
	var_Items.AddBar(h,"Unknown","01/04/2001","01/11/2001","K")
	// var_Items.ItemBar(h,"K",6) = "Start:<%=%1%><br>End:<%=%2%>"
	with (oG2antt)
		TemplateDef = [dim var_Items,h]
		TemplateDef = var_Items
		TemplateDef = h
		Template = [var_Items.ItemBar(h,"K",6) = "Start:<%=%1%><br>End:<%=%2%>"]
	endwith
oG2antt.EndUpdate()
|
|
1958
|
Is it possible to define different kinds of summary bars with using the EBN files
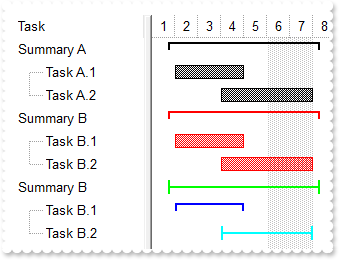
local hSummaryJ,hSummaryK,hSummaryZ,hTaskJ,hTaskK,hTaskZ,oG2antt,var_Appearance,var_Bar,var_Bar1,var_Chart,var_Items

oG2antt = form.EXG2ANTTCHARTACTIVEXCONTROL1.nativeObject
oG2antt.BeginUpdate()
var_Appearance = oG2antt.VisualAppearance
	var_Appearance.RenderType = -16777216
	var_Appearance.Add(1,"gBFLBCJwBAEHhEJAAEhABN0GACAADACAxRDAMgBQKAAzQFAYahuGSGAAGMYxQgmFgAQhFcZQSKUOQTDKMIziYBYJhEMQyDAAUIjOKsIhkGYcZAGQBJCjWGodQLOEgwHIERQjEyUJAGGQIHhyPYbUbGUpQHKkeRtGqgBgoKhKEouNYgAbGYIwTRsdyfDSXBpEWwbDgkNQwWTDNoRDIUQStCysaYjOpnfrUAJ1P7FdQ1NJkXRhGSSK7maapaiCSZ6STCMj1FhVKSNJ7DQKhGpgKh/ApgYpQOK4fLNXyRBK4QAyKA6bgPFZOZbFViaXY1V5bNKrcjhHQwAyHJ4XXRdV4YRAkUT4GqiJKGSYcQhuXZWbRqO6ABhef6DRThc6jKpFHIE4llEcojHqSZNgoIxnlgd5thsLREleL43gsYZ9BkaAYkMAgAm+CxGDWWAtiKCRfjcdRgHoHYnicUwgAIEIREAaQYkcQZUHIGRUDQJBOEYRAhDYCxGgMZAkCgdYQhaXQIAYERwQuahXggdgeG6VZ4H4IhdiIGIOB8YIiGiHZZgqYpGF4KYHiKCI+CAU5jCiTQ2g0YhEFyax4gABAEIC")
	var_Appearance.Add(2,"gBFLBCJwBAEHhEJAAEhABU0IQAAYAQGKQYhiAKBQAGaAoDDcMA4QwAAyjAKMEwsACEIrjKCRShyCYZRhGcTAJBMIhiGQYAChEZxVhEMgzDjIAxSJAcQRFESaAABGCQGh+N4/S4NIi0CIsZQjCaiZ7pKA5bgMCo+UrNMixZQVCSOGChYRpCaZWpGGodQRUFbVHAlKypJKCKrEWSrDhuYAAW7XM7yBS1TzVNSuLZtaLqSroAJ1WTWMB0Ra8NzZEKfaZACj4arKejrRDCMAggI=")
oG2antt.Columns.Add("Task")
var_Chart = oG2antt.Chart
	// var_Chart.PaneWidth(false) = 128
	with (oG2antt)
		TemplateDef = [dim var_Chart]
		TemplateDef = var_Chart
		Template = [var_Chart.PaneWidth(False) = 128]
	endwith
	var_Chart.FirstVisibleDate = "01/01/2001"
	var_Bar = var_Chart.Bars.Item("Task")
		// var_Bar.Def(4) = 18
		with (oG2antt)
			TemplateDef = [dim var_Bar]
			TemplateDef = var_Bar
			Template = [var_Bar.Def(4) = 18]
		endwith
		var_Bar.Color = 0x1
	var_Bar1 = var_Chart.Bars.Item("Summary")
		// var_Bar1.Def(4) = 18
		with (oG2antt)
			TemplateDef = [dim var_Bar1]
			TemplateDef = var_Bar1
			Template = [var_Bar1.Def(4) = 18]
		endwith
		var_Bar1.Color = 0x2000000
var_Items = oG2antt.Items
	hSummaryJ = var_Items.AddItem("Summary A")
	var_Items.AddBar(hSummaryJ,"Summary","01/02/2001","01/02/2001","J")
	hTaskJ = var_Items.InsertItem(hSummaryJ,null,"Task A.1")
	var_Items.AddBar(hTaskJ,"Task","01/02/2001","01/05/2001","J1")
	hTaskJ = var_Items.InsertItem(hSummaryJ,null,"Task A.2")
	var_Items.AddBar(hTaskJ,"Task","01/04/2001","01/08/2001","J2")
	var_Items.DefineSummaryBars(hSummaryJ,"J",-1,"<*>")
	hSummaryK = var_Items.AddItem("Summary B")
	var_Items.AddBar(hSummaryK,"Summary","01/02/2001","01/02/2001","K")
	hTaskK = var_Items.InsertItem(hSummaryK,null,"Task B.1")
	var_Items.AddBar(hTaskK,"Task","01/02/2001","01/05/2001","K1")
	hTaskK = var_Items.InsertItem(hSummaryK,null,"Task B.2")
	var_Items.AddBar(hTaskK,"Task","01/04/2001","01/08/2001","K2")
	var_Items.DefineSummaryBars(hSummaryK,"K",-1,"<*>")
	// var_Items.ItemBar(0,"<K*>",33) = 255
	with (oG2antt)
		TemplateDef = [dim var_Items]
		TemplateDef = var_Items
		Template = [var_Items.ItemBar(0,"<K*>",33) = 255]
	endwith
	hSummaryZ = var_Items.AddItem("Summary B")
	var_Items.AddBar(hSummaryZ,"Summary","01/02/2001","01/02/2001","Z")
	hTaskZ = var_Items.InsertItem(hSummaryZ,null,"Task B.1")
	var_Items.AddBar(hTaskZ,"Task","01/02/2001","01/05/2001","Z1")
	hTaskZ = var_Items.InsertItem(hSummaryZ,null,"Task B.2")
	var_Items.AddBar(hTaskZ,"Task","01/04/2001","01/08/2001","Z2")
	var_Items.DefineSummaryBars(hSummaryZ,"Z",-1,"<*>")
	// var_Items.ItemBar(hSummaryZ,"Z",33) = 16842496
	with (oG2antt)
		TemplateDef = [dim var_Items,hSummaryZ]
		TemplateDef = var_Items
		TemplateDef = hSummaryZ
		Template = [var_Items.ItemBar(hSummaryZ,"Z",33) = 16842496]
	endwith
	// var_Items.ItemBar(0,"<Z1>",33) = 50266112
	with (oG2antt)
		TemplateDef = [dim var_Items]
		TemplateDef = var_Items
		Template = [var_Items.ItemBar(0,"<Z1>",33) = 50266112]
	endwith
	// var_Items.ItemBar(0,"<Z2>",33) = 33554176
	with (oG2antt)
		TemplateDef = [dim var_Items]
		TemplateDef = var_Items
		Template = [var_Items.ItemBar(0,"<Z2>",33) = 33554176]
	endwith
	// var_Items.ExpandItem(0) = true
	with (oG2antt)
		TemplateDef = [dim var_Items]
		TemplateDef = var_Items
		Template = [var_Items.ExpandItem(0) = True]
	endwith
oG2antt.EndUpdate()
|
|
1957
|
How can I display the week-number in ISO8601 format
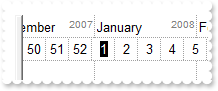
local oG2antt,var_Chart,var_Level,var_Level1

oG2antt = form.EXG2ANTTCHARTACTIVEXCONTROL1.nativeObject
oG2antt.BeginUpdate()
var_Chart = oG2antt.Chart
	// var_Chart.PaneWidth(false) = 0
	with (oG2antt)
		TemplateDef = [dim var_Chart]
		TemplateDef = var_Chart
		Template = [var_Chart.PaneWidth(False) = 0]
	endwith
	var_Chart.LevelCount = 2
	var_Chart.FirstVisibleDate = "12/12/2007"
	var_Chart.DrawGridLines = -1
	var_Chart.UnitScale = 256
	// var_Chart.Level(0).FormatLabel = "value + `<r><off -4><fgcolor=808080><font ;6>` + year(dvalue)"
	var_Level = var_Chart.Level(0)
	with (oG2antt)
		TemplateDef = [dim var_Level]
		TemplateDef = var_Level
		Template = [var_Level.FormatLabel = "value + `<r><off -4><fgcolor=808080><font ;6>` + year(dvalue)"]
	endwith
	// var_Chart.Level(1).FormatLabel = "(value = 1 ? `<bgcolor=000000><fgcolor=FFFFFF>` : ``) + value"
	var_Level1 = var_Chart.Level(1)
	with (oG2antt)
		TemplateDef = [dim var_Level1]
		TemplateDef = var_Level1
		Template = [var_Level1.FormatLabel = "(value = 1 ? `<bgcolor=000000><fgcolor=FFFFFF>` : ``) + value"]
	endwith
	var_Chart.WeekNumberAs = 0
	var_Chart.FirstWeekDay = 1
oG2antt.EndUpdate()
|
|
1956
|
I have a column right-aligned. How can I display its check box aligned to the right, as it appears to the left of the cell's caption
local oG2antt,var_Chart,var_Column,var_Column1,var_Column2,var_Columns,var_Items

oG2antt = form.EXG2ANTTCHARTACTIVEXCONTROL1.nativeObject
oG2antt.BeginUpdate()
oG2antt.ColumnAutoResize = true
// oG2antt.Chart.PaneWidth(true) = 0
var_Chart = oG2antt.Chart
with (oG2antt)
	TemplateDef = [dim var_Chart]
	TemplateDef = var_Chart
	Template = [var_Chart.PaneWidth(True) = 0]
endwith
oG2antt.DrawGridLines = 2
var_Columns = oG2antt.Columns
	var_Column = var_Columns.Add("Left")
		var_Column.AllowSizing = false
		var_Column.Width = 96
		// var_Column.Def(0) = true
		with (oG2antt)
			TemplateDef = [dim var_Column]
			TemplateDef = var_Column
			Template = [var_Column.Def(0) = True]
		endwith
		var_Column.FormatColumn = "0 pos `A-Z`"
	var_Column1 = var_Columns.Add("Center")
		var_Column1.HeaderAlignment = 1
		var_Column1.Alignment = var_Column1.HeaderAlignment
		var_Column1.AllowSizing = false
		var_Column1.Width = 96
		// var_Column1.Def(0) = true
		with (oG2antt)
			TemplateDef = [dim var_Column1]
			TemplateDef = var_Column1
			Template = [var_Column1.Def(0) = True]
		endwith
		var_Column1.FormatColumn = "0 pos `A-Z`"
	var_Column2 = var_Columns.Add("Right")
		var_Column2.HeaderAlignment = 2
		var_Column2.Alignment = var_Column2.HeaderAlignment
		var_Column2.AllowSizing = false
		var_Column2.Width = 96
		// var_Column2.Def(0) = true
		with (oG2antt)
			TemplateDef = [dim var_Column2]
			TemplateDef = var_Column2
			Template = [var_Column2.Def(0) = True]
		endwith
		var_Column2.FormatColumn = "0 pos `A-Z`"
		// var_Column2.Def(34) = "caption,check,icon,icons,picture"
		with (oG2antt)
			TemplateDef = [dim var_Column2]
			TemplateDef = var_Column2
			Template = [var_Column2.Def(34) = "caption,check,icon,icons,picture"]
		endwith
	var_Columns.Add("")
var_Items = oG2antt.Items
	// var_Items.CellState(var_Items.AddItem("Item 1"),3) = 1
	with (oG2antt)
		TemplateDef = [dim var_Items]
		TemplateDef = var_Items
		Template = [var_Items.CellState(AddItem("Item 1"),3) = 1]
	endwith
	// var_Items.CellState(var_Items.AddItem("Item 2"),2) = 1
	with (oG2antt)
		TemplateDef = [dim var_Items]
		TemplateDef = var_Items
		Template = [var_Items.CellState(AddItem("Item 2"),2) = 1]
	endwith
	// var_Items.CellState(var_Items.AddItem("Item 3"),1) = 1
	with (oG2antt)
		TemplateDef = [dim var_Items]
		TemplateDef = var_Items
		Template = [var_Items.CellState(AddItem("Item 3"),1) = 1]
	endwith
oG2antt.EndUpdate()
|
|
1955
|
Can I display the column's multiple-lines caption vertically oriented (method 2)
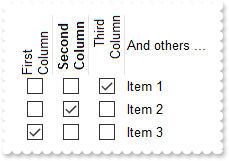
local oG2antt,var_Chart,var_Column,var_Column1,var_Column2,var_Columns,var_Items

oG2antt = form.EXG2ANTTCHARTACTIVEXCONTROL1.nativeObject
oG2antt.BeginUpdate()
oG2antt.HeaderHeight = 48
oG2antt.ColumnAutoResize = true
// oG2antt.Chart.PaneWidth(true) = 0
var_Chart = oG2antt.Chart
with (oG2antt)
	TemplateDef = [dim var_Chart]
	TemplateDef = var_Chart
	Template = [var_Chart.PaneWidth(True) = 0]
endwith
var_Columns = oG2antt.Columns
	var_Columns.Add("And others ...")
	var_Column = var_Columns.Add("")
		var_Column.HTMLCaption = "First Column"
		var_Column.HeaderVertical = true
		var_Column.Width = 36
		var_Column.AllowSizing = false
		// var_Column.Def(0) = true
		with (oG2antt)
			TemplateDef = [dim var_Column]
			TemplateDef = var_Column
			Template = [var_Column.Def(0) = True]
		endwith
		// var_Column.Def(48) = 8
		with (oG2antt)
			TemplateDef = [dim var_Column]
			TemplateDef = var_Column
			Template = [var_Column.Def(48) = 8]
		endwith
		var_Column.Position = 0
	var_Column1 = var_Columns.Add("")
		var_Column1.HTMLCaption = "<c><b>Second Column"
		var_Column1.HeaderVertical = true
		var_Column1.Width = 36
		var_Column1.AllowSizing = false
		// var_Column1.Def(0) = true
		with (oG2antt)
			TemplateDef = [dim var_Column1]
			TemplateDef = var_Column1
			Template = [var_Column1.Def(0) = True]
		endwith
		// var_Column1.Def(48) = 8
		with (oG2antt)
			TemplateDef = [dim var_Column1]
			TemplateDef = var_Column1
			Template = [var_Column1.Def(48) = 8]
		endwith
		var_Column1.Position = 1
	var_Column2 = var_Columns.Add("")
		var_Column2.HTMLCaption = "<r>Third Column"
		var_Column2.HeaderVertical = true
		var_Column2.Width = 36
		var_Column2.AllowSizing = false
		// var_Column2.Def(0) = true
		with (oG2antt)
			TemplateDef = [dim var_Column2]
			TemplateDef = var_Column2
			Template = [var_Column2.Def(0) = True]
		endwith
		// var_Column2.Def(48) = 8
		with (oG2antt)
			TemplateDef = [dim var_Column2]
			TemplateDef = var_Column2
			Template = [var_Column2.Def(48) = 8]
		endwith
		var_Column2.Position = 2
var_Items = oG2antt.Items
	// var_Items.CellState(var_Items.AddItem("Item 1"),3) = 1
	with (oG2antt)
		TemplateDef = [dim var_Items]
		TemplateDef = var_Items
		Template = [var_Items.CellState(AddItem("Item 1"),3) = 1]
	endwith
	// var_Items.CellState(var_Items.AddItem("Item 2"),2) = 1
	with (oG2antt)
		TemplateDef = [dim var_Items]
		TemplateDef = var_Items
		Template = [var_Items.CellState(AddItem("Item 2"),2) = 1]
	endwith
	// var_Items.CellState(var_Items.AddItem("Item 3"),1) = 1
	with (oG2antt)
		TemplateDef = [dim var_Items]
		TemplateDef = var_Items
		Template = [var_Items.CellState(AddItem("Item 3"),1) = 1]
	endwith
oG2antt.EndUpdate()
|
|
1954
|
Can I display the column's multiple-lines caption vertically oriented (method 1)
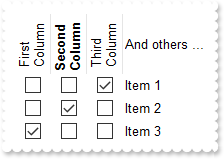
local oG2antt,var_Chart,var_Column,var_Column1,var_Column2,var_Columns,var_Items

oG2antt = form.EXG2ANTTCHARTACTIVEXCONTROL1.nativeObject
oG2antt.BeginUpdate()
oG2antt.HeaderHeight = 48
oG2antt.HeaderSingleLine = false
oG2antt.ColumnAutoResize = true
// oG2antt.Chart.PaneWidth(true) = 0
var_Chart = oG2antt.Chart
with (oG2antt)
	TemplateDef = [dim var_Chart]
	TemplateDef = var_Chart
	Template = [var_Chart.PaneWidth(True) = 0]
endwith
var_Columns = oG2antt.Columns
	var_Columns.Add("And others ...")
	var_Column = var_Columns.Add("First Column")
		var_Column.HeaderVertical = true
		var_Column.Width = 36
		var_Column.AllowSizing = false
		// var_Column.Def(0) = true
		with (oG2antt)
			TemplateDef = [dim var_Column]
			TemplateDef = var_Column
			Template = [var_Column.Def(0) = True]
		endwith
		// var_Column.Def(48) = 8
		with (oG2antt)
			TemplateDef = [dim var_Column]
			TemplateDef = var_Column
			Template = [var_Column.Def(48) = 8]
		endwith
		var_Column.Position = 0
	var_Column1 = var_Columns.Add("Second Column")
		var_Column1.HeaderBold = true
		var_Column1.HeaderVertical = true
		var_Column1.Width = 36
		var_Column1.AllowSizing = false
		// var_Column1.Def(0) = true
		with (oG2antt)
			TemplateDef = [dim var_Column1]
			TemplateDef = var_Column1
			Template = [var_Column1.Def(0) = True]
		endwith
		// var_Column1.Def(48) = 8
		with (oG2antt)
			TemplateDef = [dim var_Column1]
			TemplateDef = var_Column1
			Template = [var_Column1.Def(48) = 8]
		endwith
		var_Column1.Position = 1
	var_Column2 = var_Columns.Add("Third Column")
		var_Column2.HeaderVertical = true
		var_Column2.Width = 36
		var_Column2.AllowSizing = false
		// var_Column2.Def(0) = true
		with (oG2antt)
			TemplateDef = [dim var_Column2]
			TemplateDef = var_Column2
			Template = [var_Column2.Def(0) = True]
		endwith
		// var_Column2.Def(48) = 8
		with (oG2antt)
			TemplateDef = [dim var_Column2]
			TemplateDef = var_Column2
			Template = [var_Column2.Def(48) = 8]
		endwith
		var_Column2.Position = 2
var_Items = oG2antt.Items
	// var_Items.CellState(var_Items.AddItem("Item 1"),3) = 1
	with (oG2antt)
		TemplateDef = [dim var_Items]
		TemplateDef = var_Items
		Template = [var_Items.CellState(AddItem("Item 1"),3) = 1]
	endwith
	// var_Items.CellState(var_Items.AddItem("Item 2"),2) = 1
	with (oG2antt)
		TemplateDef = [dim var_Items]
		TemplateDef = var_Items
		Template = [var_Items.CellState(AddItem("Item 2"),2) = 1]
	endwith
	// var_Items.CellState(var_Items.AddItem("Item 3"),1) = 1
	with (oG2antt)
		TemplateDef = [dim var_Items]
		TemplateDef = var_Items
		Template = [var_Items.CellState(AddItem("Item 3"),1) = 1]
	endwith
oG2antt.EndUpdate()
|
|
1953
|
Can I display the column's caption vertically oriented (method 2)
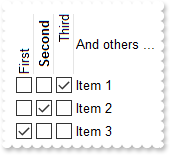
local oG2antt,var_Chart,var_Column,var_Column1,var_Column2,var_Columns,var_Items

oG2antt = form.EXG2ANTTCHARTACTIVEXCONTROL1.nativeObject
oG2antt.BeginUpdate()
oG2antt.HeaderHeight = 48
oG2antt.ColumnAutoResize = true
// oG2antt.Chart.PaneWidth(true) = 0
var_Chart = oG2antt.Chart
with (oG2antt)
	TemplateDef = [dim var_Chart]
	TemplateDef = var_Chart
	Template = [var_Chart.PaneWidth(True) = 0]
endwith
var_Columns = oG2antt.Columns
	var_Columns.Add("And others ...")
	var_Column = var_Columns.Add("")
		var_Column.HTMLCaption = "First"
		var_Column.HeaderVertical = true
		var_Column.Width = 20
		var_Column.AllowSizing = false
		// var_Column.Def(0) = true
		with (oG2antt)
			TemplateDef = [dim var_Column]
			TemplateDef = var_Column
			Template = [var_Column.Def(0) = True]
		endwith
		var_Column.Position = 0
	var_Column1 = var_Columns.Add("")
		var_Column1.HTMLCaption = "<c><b>Second"
		var_Column1.HeaderVertical = true
		var_Column1.Width = 20
		var_Column1.AllowSizing = false
		// var_Column1.Def(0) = true
		with (oG2antt)
			TemplateDef = [dim var_Column1]
			TemplateDef = var_Column1
			Template = [var_Column1.Def(0) = True]
		endwith
		var_Column1.Position = 1
	var_Column2 = var_Columns.Add("")
		var_Column2.HTMLCaption = "<r>Third"
		var_Column2.HeaderVertical = true
		var_Column2.Width = 20
		var_Column2.AllowSizing = false
		// var_Column2.Def(0) = true
		with (oG2antt)
			TemplateDef = [dim var_Column2]
			TemplateDef = var_Column2
			Template = [var_Column2.Def(0) = True]
		endwith
		var_Column2.Position = 2
var_Items = oG2antt.Items
	// var_Items.CellState(var_Items.AddItem("Item 1"),3) = 1
	with (oG2antt)
		TemplateDef = [dim var_Items]
		TemplateDef = var_Items
		Template = [var_Items.CellState(AddItem("Item 1"),3) = 1]
	endwith
	// var_Items.CellState(var_Items.AddItem("Item 2"),2) = 1
	with (oG2antt)
		TemplateDef = [dim var_Items]
		TemplateDef = var_Items
		Template = [var_Items.CellState(AddItem("Item 2"),2) = 1]
	endwith
	// var_Items.CellState(var_Items.AddItem("Item 3"),1) = 1
	with (oG2antt)
		TemplateDef = [dim var_Items]
		TemplateDef = var_Items
		Template = [var_Items.CellState(AddItem("Item 3"),1) = 1]
	endwith
oG2antt.EndUpdate()
|
|
1952
|
Can I display the column's caption vertically oriented (method 1)
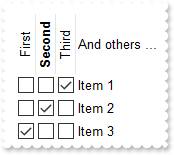
local oG2antt,var_Chart,var_Column,var_Column1,var_Column2,var_Columns,var_Items

oG2antt = form.EXG2ANTTCHARTACTIVEXCONTROL1.nativeObject
oG2antt.BeginUpdate()
oG2antt.HeaderHeight = 48
oG2antt.ColumnAutoResize = true
// oG2antt.Chart.PaneWidth(true) = 0
var_Chart = oG2antt.Chart
with (oG2antt)
	TemplateDef = [dim var_Chart]
	TemplateDef = var_Chart
	Template = [var_Chart.PaneWidth(True) = 0]
endwith
var_Columns = oG2antt.Columns
	var_Columns.Add("And others ...")
	var_Column = var_Columns.Add("First")
		var_Column.HeaderVertical = true
		var_Column.Width = 20
		var_Column.AllowSizing = false
		// var_Column.Def(0) = true
		with (oG2antt)
			TemplateDef = [dim var_Column]
			TemplateDef = var_Column
			Template = [var_Column.Def(0) = True]
		endwith
		var_Column.Position = 0
	var_Column1 = var_Columns.Add("Second")
		var_Column1.HeaderBold = true
		var_Column1.HeaderVertical = true
		var_Column1.Width = 20
		var_Column1.AllowSizing = false
		// var_Column1.Def(0) = true
		with (oG2antt)
			TemplateDef = [dim var_Column1]
			TemplateDef = var_Column1
			Template = [var_Column1.Def(0) = True]
		endwith
		var_Column1.Position = 1
	var_Column2 = var_Columns.Add("Third")
		var_Column2.HeaderVertical = true
		var_Column2.Width = 20
		var_Column2.AllowSizing = false
		// var_Column2.Def(0) = true
		with (oG2antt)
			TemplateDef = [dim var_Column2]
			TemplateDef = var_Column2
			Template = [var_Column2.Def(0) = True]
		endwith
		var_Column2.Position = 2
var_Items = oG2antt.Items
	// var_Items.CellState(var_Items.AddItem("Item 1"),3) = 1
	with (oG2antt)
		TemplateDef = [dim var_Items]
		TemplateDef = var_Items
		Template = [var_Items.CellState(AddItem("Item 1"),3) = 1]
	endwith
	// var_Items.CellState(var_Items.AddItem("Item 2"),2) = 1
	with (oG2antt)
		TemplateDef = [dim var_Items]
		TemplateDef = var_Items
		Template = [var_Items.CellState(AddItem("Item 2"),2) = 1]
	endwith
	// var_Items.CellState(var_Items.AddItem("Item 3"),1) = 1
	with (oG2antt)
		TemplateDef = [dim var_Items]
		TemplateDef = var_Items
		Template = [var_Items.CellState(AddItem("Item 3"),1) = 1]
	endwith
oG2antt.EndUpdate()
|
|
1951
|
How can I resize all task-bars 0-length
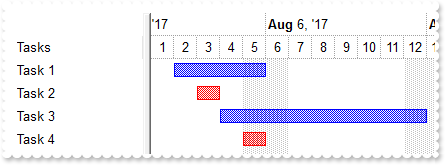
local oG2antt,var_Chart,var_Items

oG2antt = form.EXG2ANTTCHARTACTIVEXCONTROL1.nativeObject
oG2antt.BeginUpdate()
oG2antt.Columns.Add("Tasks")
var_Chart = oG2antt.Chart
	var_Chart.FirstVisibleDate = "08/01/2017"
	var_Chart.LevelCount = 2
	// var_Chart.PaneWidth(false) = 128
	with (oG2antt)
		TemplateDef = [dim var_Chart]
		TemplateDef = var_Chart
		Template = [var_Chart.PaneWidth(False) = 128]
	endwith
var_Items = oG2antt.Items
	var_Items.AddBar(var_Items.AddItem("Task 1"),"Task","08/02/2017","08/06/2017")
	var_Items.AddBar(var_Items.AddItem("Task 2"),"Task","08/03/2017","08/03/2017")
	var_Items.AddBar(var_Items.AddItem("Task 3"),"Task","08/04/2017","08/13/2017")
	var_Items.AddBar(var_Items.AddItem("Task 4"),"Task","08/05/2017","08/05/2017")
	// var_Items.ItemBarEx("itembar(513) = 0 and itembar(0) = `Task`",33) = 255
	with (oG2antt)
		TemplateDef = [dim var_Items]
		TemplateDef = var_Items
		Template = [var_Items.ItemBarEx("itembar(513) = 0 and itembar(0) = `Task`",33) = 255]
	endwith
	// var_Items.ItemBarEx("itembar(513) = 0 and itembar(0) = `Task`",513) = "value + 1"
	with (oG2antt)
		TemplateDef = [dim var_Items]
		TemplateDef = var_Items
		Template = [var_Items.ItemBarEx("itembar(513) = 0 and itembar(0) = `Task`",513) = "value + 1"]
	endwith
oG2antt.EndUpdate()
|
|
1950
|
Is it possible to mark items that holds items with 0-length (zero,empty, sample 3)
local oG2antt,var_Chart,var_Column,var_ConditionalFormat,var_Items

oG2antt = form.EXG2ANTTCHARTACTIVEXCONTROL1.nativeObject
oG2antt.BeginUpdate()
oG2antt.Columns.Add("Tasks")
var_Column = oG2antt.Columns.Add("Duration")
	// var_Column.Def(18) = 513
	with (oG2antt)
		TemplateDef = [dim var_Column]
		TemplateDef = var_Column
		Template = [var_Column.Def(18) = 513]
	endwith
	var_Column.Visible = false
var_Chart = oG2antt.Chart
	var_Chart.FirstVisibleDate = "08/01/2017"
	var_Chart.LevelCount = 2
	// var_Chart.PaneWidth(false) = 128
	with (oG2antt)
		TemplateDef = [dim var_Chart]
		TemplateDef = var_Chart
		Template = [var_Chart.PaneWidth(False) = 128]
	endwith
var_ConditionalFormat = oG2antt.ConditionalFormats.Add("%1 = 0")
	var_ConditionalFormat.Bold = true
	var_ConditionalFormat.BackColor = 0xbebebe
	var_ConditionalFormat.ChartBackColor = var_ConditionalFormat.BackColor
var_Items = oG2antt.Items
	var_Items.AllowCellValueToItemBar = true
	var_Items.AddBar(var_Items.AddItem("Task 1"),"Task","08/02/2017","08/06/2017")
	var_Items.AddBar(var_Items.AddItem("Task 2"),"Task","08/03/2017","08/03/2017")
	var_Items.AddBar(var_Items.AddItem("Task 3"),"Task","08/04/2017","08/13/2017")
	var_Items.AddBar(var_Items.AddItem("Task 4"),"Task","08/05/2017","08/05/2017")
oG2antt.EndUpdate()
|
|
1949
|
Is it possible to mark items that holds items with 0-length (zero,empty, sample 2)
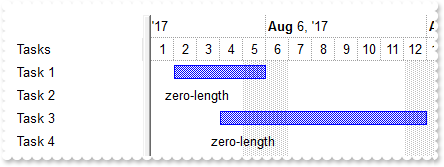
local oG2antt,var_Chart,var_Items

oG2antt = form.EXG2ANTTCHARTACTIVEXCONTROL1.nativeObject
oG2antt.BeginUpdate()
oG2antt.Columns.Add("Tasks")
var_Chart = oG2antt.Chart
	var_Chart.FirstVisibleDate = "08/01/2017"
	var_Chart.LevelCount = 2
	// var_Chart.PaneWidth(false) = 128
	with (oG2antt)
		TemplateDef = [dim var_Chart]
		TemplateDef = var_Chart
		Template = [var_Chart.PaneWidth(False) = 128]
	endwith
var_Items = oG2antt.Items
	var_Items.AddBar(var_Items.AddItem("Task 1"),"Task","08/02/2017","08/06/2017")
	var_Items.AddBar(var_Items.AddItem("Task 2"),"Task","08/03/2017","08/03/2017")
	var_Items.AddBar(var_Items.AddItem("Task 3"),"Task","08/04/2017","08/13/2017")
	var_Items.AddBar(var_Items.AddItem("Task 4"),"Task","08/05/2017","08/05/2017")
	// var_Items.ItemBarEx("itembar(513) = 0",3) = "`zero-length`"
	with (oG2antt)
		TemplateDef = [dim var_Items]
		TemplateDef = var_Items
		Template = [var_Items.ItemBarEx("itembar(513) = 0",3) = "`zero-length`"]
	endwith
oG2antt.EndUpdate()
|
|
1948
|
Is it possible to mark items that holds items with 0-length (zero,empty, sample 1)
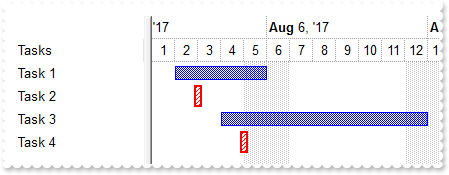
local oG2antt,var_Chart,var_Items

oG2antt = form.EXG2ANTTCHARTACTIVEXCONTROL1.nativeObject
oG2antt.BeginUpdate()
oG2antt.Columns.Add("Tasks")
var_Chart = oG2antt.Chart
	var_Chart.FirstVisibleDate = "08/01/2017"
	var_Chart.LevelCount = 2
	// var_Chart.PaneWidth(false) = 128
	with (oG2antt)
		TemplateDef = [dim var_Chart]
		TemplateDef = var_Chart
		Template = [var_Chart.PaneWidth(False) = 128]
	endwith
var_Items = oG2antt.Items
	var_Items.AddBar(var_Items.AddItem("Task 1"),"Task","08/02/2017","08/06/2017")
	var_Items.AddBar(var_Items.AddItem("Task 2"),"Task","08/03/2017","08/03/2017")
	var_Items.AddBar(var_Items.AddItem("Task 3"),"Task","08/04/2017","08/13/2017")
	var_Items.AddBar(var_Items.AddItem("Task 4"),"Task","08/05/2017","08/05/2017")
	// var_Items.ItemBarEx("itembar(513) = 0",53) = "`[frame=RGB(255,0,0),framethick,pattern=6,patterncolor=RGB(255,0,0)]`"
	with (oG2antt)
		TemplateDef = [dim var_Items]
		TemplateDef = var_Items
		Template = [var_Items.ItemBarEx("itembar(513) = 0",53) = "`[frame=RGB(255,0,0),framethick,pattern=6,patterncolor=RGB(255,0,0)]`"]
	endwith
	// var_Items.ItemBarEx("itembar(513) = 0",55) = "`-4,-4,4,4`"
	with (oG2antt)
		TemplateDef = [dim var_Items]
		TemplateDef = var_Items
		Template = [var_Items.ItemBarEx("itembar(513) = 0",55) = "`-4,-4,4,4`"]
	endwith
oG2antt.EndUpdate()
|
|
1947
|
How can I find how many tasks/bars of 0-length (zero,empty) do I have
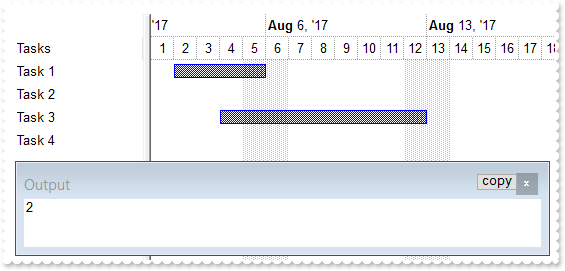
local oG2antt,var_Chart,var_Items

oG2antt = form.EXG2ANTTCHARTACTIVEXCONTROL1.nativeObject
oG2antt.BeginUpdate()
oG2antt.Columns.Add("Tasks")
var_Chart = oG2antt.Chart
	var_Chart.FirstVisibleDate = "08/01/2017"
	var_Chart.LevelCount = 2
	// var_Chart.PaneWidth(false) = 128
	with (oG2antt)
		TemplateDef = [dim var_Chart]
		TemplateDef = var_Chart
		Template = [var_Chart.PaneWidth(False) = 128]
	endwith
var_Items = oG2antt.Items
	var_Items.AddBar(var_Items.AddItem("Task 1"),"Task","08/02/2017","08/06/2017")
	var_Items.AddBar(var_Items.AddItem("Task 2"),"Task","08/03/2017","08/03/2017")
	var_Items.AddBar(var_Items.AddItem("Task 3"),"Task","08/04/2017","08/13/2017")
	var_Items.AddBar(var_Items.AddItem("Task 4"),"Task","08/05/2017","08/05/2017")
	? Str(var_Items.ItemBarEx("itembar(513) = 0",256))
oG2antt.EndUpdate()
|
|
1946
|
How can I remove all bars from selected items
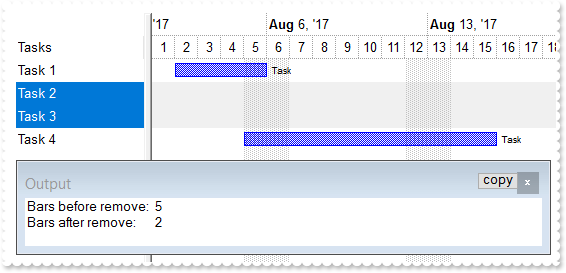
local h,oG2antt,var_Bar,var_Bar1,var_Chart,var_Items

oG2antt = form.EXG2ANTTCHARTACTIVEXCONTROL1.nativeObject
oG2antt.BeginUpdate()
oG2antt.SingleSel = false
oG2antt.Columns.Add("Tasks")
var_Chart = oG2antt.Chart
	var_Chart.FirstVisibleDate = "08/01/2017"
	var_Chart.LevelCount = 2
	// var_Chart.PaneWidth(false) = 128
	with (oG2antt)
		TemplateDef = [dim var_Chart]
		TemplateDef = var_Chart
		Template = [var_Chart.PaneWidth(False) = 128]
	endwith
	var_Chart.SelBackColor = 0xf0f0f0
	var_Bar = var_Chart.Bars.Item("Task")
		var_Bar.OverlaidType = 3
		var_Bar.OverlaidGroup = "Task,Task-Diff"
		// var_Bar.Def(3) = "<font ;6><%=%0%>"
		with (oG2antt)
			TemplateDef = [dim var_Bar]
			TemplateDef = var_Bar
			Template = [var_Bar.Def(3) = "<font ;6><%=%0%>"]
		endwith
		// var_Bar.Def(4) = 18
		with (oG2antt)
			TemplateDef = [dim var_Bar]
			TemplateDef = var_Bar
			Template = [var_Bar.Def(4) = 18]
		endwith
	var_Bar1 = var_Chart.Bars.Copy("Task","Task-Diff")
		var_Bar1.Height = 4
		var_Bar1.Color = 0xff
		// var_Bar1.Def(3) = "<font ;6><%=%0%>"
		with (oG2antt)
			TemplateDef = [dim var_Bar1]
			TemplateDef = var_Bar1
			Template = [var_Bar1.Def(3) = "<font ;6><%=%0%>"]
		endwith
		// var_Bar1.Def(4) = 16
		with (oG2antt)
			TemplateDef = [dim var_Bar1]
			TemplateDef = var_Bar1
			Template = [var_Bar1.Def(4) = 16]
		endwith
var_Items = oG2antt.Items
	var_Items.AddBar(var_Items.AddItem("Task 1"),"Task","08/02/2017","08/06/2017")
	h = var_Items.AddItem("Task 2")
	var_Items.AddBar(h,"Task","08/03/2017","08/09/2017")
	// var_Items.SelectItem(h) = true
	with (oG2antt)
		TemplateDef = [dim var_Items,h]
		TemplateDef = var_Items
		TemplateDef = h
		Template = [var_Items.SelectItem(h) = True]
	endwith
	h = var_Items.AddItem("Task 3")
	var_Items.AddBar(h,"Task","08/04/2017","08/13/2017","")
	var_Items.AddBar(h,"Task-Diff","08/05/2017","08/14/2017","P")
	// var_Items.SelectItem(h) = true
	with (oG2antt)
		TemplateDef = [dim var_Items,h]
		TemplateDef = var_Items
		TemplateDef = h
		Template = [var_Items.SelectItem(h) = True]
	endwith
	var_Items.AddBar(var_Items.AddItem("Task 4"),"Task","08/05/2017","08/16/2017")
	? "Bars before remove: "
	? Str(var_Items.ItemBar(0,"<*>",256))
	// var_Items.ItemBarEx("itemisselected",9) = "`toberemove` + value "
	with (oG2antt)
		TemplateDef = [dim var_Items]
		TemplateDef = var_Items
		Template = [var_Items.ItemBarEx("itemisselected",9) = "`toberemove` + value "]
	endwith
	var_Items.RemoveBar(0,"<toberemove*>")
	? "Bars after remove: "
	? Str(var_Items.ItemBar(0,"<*>",256))
oG2antt.EndUpdate()
|
|
1945
|
How can I remove task bars from selected items
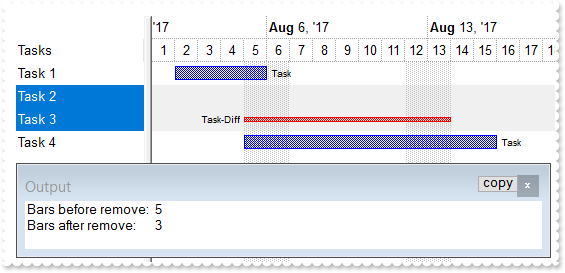
local h,oG2antt,var_Bar,var_Bar1,var_Chart,var_Items

oG2antt = form.EXG2ANTTCHARTACTIVEXCONTROL1.nativeObject
oG2antt.BeginUpdate()
oG2antt.SingleSel = false
oG2antt.Columns.Add("Tasks")
var_Chart = oG2antt.Chart
	var_Chart.FirstVisibleDate = "08/01/2017"
	var_Chart.LevelCount = 2
	// var_Chart.PaneWidth(false) = 128
	with (oG2antt)
		TemplateDef = [dim var_Chart]
		TemplateDef = var_Chart
		Template = [var_Chart.PaneWidth(False) = 128]
	endwith
	var_Chart.SelBackColor = 0xf0f0f0
	var_Bar = var_Chart.Bars.Item("Task")
		var_Bar.OverlaidType = 3
		var_Bar.OverlaidGroup = "Task,Task-Diff"
		// var_Bar.Def(3) = "<font ;6><%=%0%>"
		with (oG2antt)
			TemplateDef = [dim var_Bar]
			TemplateDef = var_Bar
			Template = [var_Bar.Def(3) = "<font ;6><%=%0%>"]
		endwith
		// var_Bar.Def(4) = 18
		with (oG2antt)
			TemplateDef = [dim var_Bar]
			TemplateDef = var_Bar
			Template = [var_Bar.Def(4) = 18]
		endwith
	var_Bar1 = var_Chart.Bars.Copy("Task","Task-Diff")
		var_Bar1.Height = 4
		var_Bar1.Color = 0xff
		// var_Bar1.Def(3) = "<font ;6><%=%0%>"
		with (oG2antt)
			TemplateDef = [dim var_Bar1]
			TemplateDef = var_Bar1
			Template = [var_Bar1.Def(3) = "<font ;6><%=%0%>"]
		endwith
		// var_Bar1.Def(4) = 16
		with (oG2antt)
			TemplateDef = [dim var_Bar1]
			TemplateDef = var_Bar1
			Template = [var_Bar1.Def(4) = 16]
		endwith
var_Items = oG2antt.Items
	var_Items.AddBar(var_Items.AddItem("Task 1"),"Task","08/02/2017","08/06/2017")
	h = var_Items.AddItem("Task 2")
	var_Items.AddBar(h,"Task","08/03/2017","08/09/2017")
	// var_Items.SelectItem(h) = true
	with (oG2antt)
		TemplateDef = [dim var_Items,h]
		TemplateDef = var_Items
		TemplateDef = h
		Template = [var_Items.SelectItem(h) = True]
	endwith
	h = var_Items.AddItem("Task 3")
	var_Items.AddBar(h,"Task","08/04/2017","08/13/2017","")
	var_Items.AddBar(h,"Task-Diff","08/05/2017","08/14/2017","P")
	// var_Items.SelectItem(h) = true
	with (oG2antt)
		TemplateDef = [dim var_Items,h]
		TemplateDef = var_Items
		TemplateDef = h
		Template = [var_Items.SelectItem(h) = True]
	endwith
	var_Items.AddBar(var_Items.AddItem("Task 4"),"Task","08/05/2017","08/16/2017")
	? "Bars before remove: "
	? Str(var_Items.ItemBar(0,"<*>",256))
	// var_Items.ItemBarEx("itemisselected and itembar(0) = `Task`",9) = "`toberemove` + value "
	with (oG2antt)
		TemplateDef = [dim var_Items]
		TemplateDef = var_Items
		Template = [var_Items.ItemBarEx("itemisselected and itembar(0) = `Task`",9) = "`toberemove` + value "]
	endwith
	var_Items.RemoveBar(0,"<toberemove*>")
	? "Bars after remove: "
	? Str(var_Items.ItemBar(0,"<*>",256))
oG2antt.EndUpdate()
|
|
1944
|
How can I change the pattern for some bars only
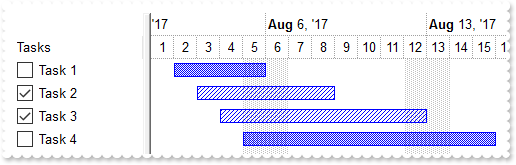
local h,oG2antt,var_Chart,var_Column,var_Items

oG2antt = form.EXG2ANTTCHARTACTIVEXCONTROL1.nativeObject
oG2antt.BeginUpdate()
// oG2antt.Columns.Add("Tasks").Def(0) = true
var_Column = oG2antt.Columns.Add("Tasks")
with (oG2antt)
	TemplateDef = [dim var_Column]
	TemplateDef = var_Column
	Template = [var_Column.Def(0) = True]
endwith
var_Chart = oG2antt.Chart
	var_Chart.FirstVisibleDate = "08/01/2017"
	var_Chart.LevelCount = 2
	// var_Chart.PaneWidth(false) = 128
	with (oG2antt)
		TemplateDef = [dim var_Chart]
		TemplateDef = var_Chart
		Template = [var_Chart.PaneWidth(False) = 128]
	endwith
var_Items = oG2antt.Items
	var_Items.AddBar(var_Items.AddItem("Task 1"),"Task","08/02/2017","08/06/2017")
	h = var_Items.AddItem("Task 2")
	var_Items.AddBar(h,"Task","08/03/2017","08/09/2017")
	// var_Items.CellState(h,0) = 1
	with (oG2antt)
		TemplateDef = [dim var_Items,h]
		TemplateDef = var_Items
		TemplateDef = h
		Template = [var_Items.CellState(h,0) = 1]
	endwith
	h = var_Items.AddItem("Task 3")
	var_Items.AddBar(h,"Task","08/04/2017","08/13/2017")
	// var_Items.CellState(h,0) = 1
	with (oG2antt)
		TemplateDef = [dim var_Items,h]
		TemplateDef = var_Items
		TemplateDef = h
		Template = [var_Items.CellState(h,0) = 1]
	endwith
	var_Items.AddBar(var_Items.AddItem("Task 4"),"Task","08/05/2017","08/16/2017")
	// var_Items.ItemBarEx("cellstate(0)",42) = 6
	with (oG2antt)
		TemplateDef = [dim var_Items]
		TemplateDef = var_Items
		Template = [var_Items.ItemBarEx("cellstate(0)",42) = 6]
	endwith
oG2antt.EndUpdate()
|
|
1943
|
How do I apply the same effort to all bars
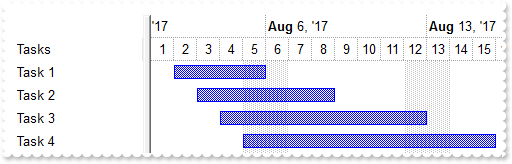
local oG2antt,var_Bar,var_Chart,var_Items

oG2antt = form.EXG2ANTTCHARTACTIVEXCONTROL1.nativeObject
oG2antt.BeginUpdate()
oG2antt.Columns.Add("Tasks")
var_Chart = oG2antt.Chart
	var_Chart.FirstVisibleDate = "08/01/2017"
	var_Chart.LevelCount = 2
	// var_Chart.PaneWidth(false) = 128
	with (oG2antt)
		TemplateDef = [dim var_Chart]
		TemplateDef = var_Chart
		Template = [var_Chart.PaneWidth(False) = 128]
	endwith
	var_Chart.HistogramView = 112
	var_Chart.HistogramVisible = true
	var_Chart.HistogramHeight = 64
	var_Bar = var_Chart.Bars.Item("Task")
		var_Bar.HistogramPattern = 6
		var_Bar.HistogramType = 1
var_Items = oG2antt.Items
	var_Items.AddBar(var_Items.AddItem("Task 1"),"Task","08/02/2017","08/06/2017")
	var_Items.AddBar(var_Items.AddItem("Task 2"),"Task","08/03/2017","08/09/2017")
	var_Items.AddBar(var_Items.AddItem("Task 3"),"Task","08/04/2017","08/13/2017")
	var_Items.AddBar(var_Items.AddItem("Task 4"),"Task","08/05/2017","08/16/2017")
	// var_Items.ItemBarEx(true,21) = 2
	with (oG2antt)
		TemplateDef = [dim var_Items]
		TemplateDef = var_Items
		Template = [var_Items.ItemBarEx(True,21) = 2]
	endwith
oG2antt.EndUpdate()
|
|
1942
|
How do I apply the same percent to all bars
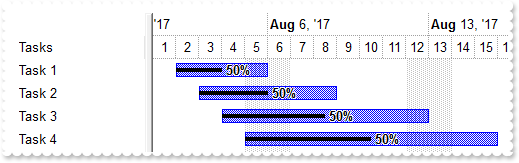
local oG2antt,var_Bar,var_Chart,var_Items

oG2antt = form.EXG2ANTTCHARTACTIVEXCONTROL1.nativeObject
oG2antt.BeginUpdate()
oG2antt.Columns.Add("Tasks")
var_Chart = oG2antt.Chart
	var_Chart.FirstVisibleDate = "08/01/2017"
	var_Chart.LevelCount = 2
	// var_Chart.PaneWidth(false) = 128
	with (oG2antt)
		TemplateDef = [dim var_Chart]
		TemplateDef = var_Chart
		Template = [var_Chart.PaneWidth(False) = 128]
	endwith
	var_Bar = var_Chart.Bars.Add("Task%Progress")
		var_Bar.Shortcut = "Task"
		// var_Bar.Def(14) = true
		with (oG2antt)
			TemplateDef = [dim var_Bar]
			TemplateDef = var_Bar
			Template = [var_Bar.Def(14) = True]
		endwith
var_Items = oG2antt.Items
	var_Items.AddBar(var_Items.AddItem("Task 1"),"Task","08/02/2017","08/06/2017")
	var_Items.AddBar(var_Items.AddItem("Task 2"),"Task","08/03/2017","08/09/2017")
	var_Items.AddBar(var_Items.AddItem("Task 3"),"Task","08/04/2017","08/13/2017")
	var_Items.AddBar(var_Items.AddItem("Task 4"),"Task","08/05/2017","08/16/2017")
	// var_Items.ItemBarEx(true,12) = 0.5
	with (oG2antt)
		TemplateDef = [dim var_Items]
		TemplateDef = var_Items
		Template = [var_Items.ItemBarEx(True,12) = 0.5]
	endwith
oG2antt.EndUpdate()
|
|
1941
|
How can I set the same duration for all bars
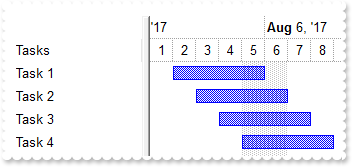
local oG2antt,var_Chart,var_Items

oG2antt = form.EXG2ANTTCHARTACTIVEXCONTROL1.nativeObject
oG2antt.BeginUpdate()
oG2antt.Columns.Add("Tasks")
var_Chart = oG2antt.Chart
	var_Chart.FirstVisibleDate = "08/01/2017"
	var_Chart.LevelCount = 2
	// var_Chart.PaneWidth(false) = 128
	with (oG2antt)
		TemplateDef = [dim var_Chart]
		TemplateDef = var_Chart
		Template = [var_Chart.PaneWidth(False) = 128]
	endwith
var_Items = oG2antt.Items
	var_Items.AddBar(var_Items.AddItem("Task 1"),"Task","08/02/2017","08/06/2017")
	var_Items.AddBar(var_Items.AddItem("Task 2"),"Task","08/03/2017","08/09/2017")
	var_Items.AddBar(var_Items.AddItem("Task 3"),"Task","08/04/2017","08/13/2017")
	var_Items.AddBar(var_Items.AddItem("Task 4"),"Task","08/05/2017","08/16/2017")
	// var_Items.ItemBarEx(true,513) = 4
	with (oG2antt)
		TemplateDef = [dim var_Items]
		TemplateDef = var_Items
		Template = [var_Items.ItemBarEx(True,513) = 4]
	endwith
oG2antt.EndUpdate()
|
|
1940
|
How do I move all bars to end at the same date-time
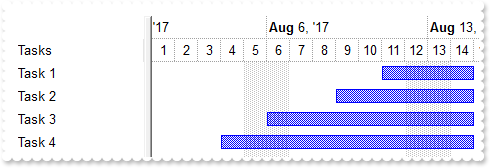
local oG2antt,var_Chart,var_Items

oG2antt = form.EXG2ANTTCHARTACTIVEXCONTROL1.nativeObject
oG2antt.BeginUpdate()
oG2antt.Columns.Add("Tasks")
var_Chart = oG2antt.Chart
	var_Chart.FirstVisibleDate = "08/01/2017"
	var_Chart.LevelCount = 2
	// var_Chart.PaneWidth(false) = 128
	with (oG2antt)
		TemplateDef = [dim var_Chart]
		TemplateDef = var_Chart
		Template = [var_Chart.PaneWidth(False) = 128]
	endwith
var_Items = oG2antt.Items
	var_Items.AddBar(var_Items.AddItem("Task 1"),"Task","08/02/2017","08/06/2017")
	var_Items.AddBar(var_Items.AddItem("Task 2"),"Task","08/03/2017","08/09/2017")
	var_Items.AddBar(var_Items.AddItem("Task 3"),"Task","08/04/2017","08/13/2017")
	var_Items.AddBar(var_Items.AddItem("Task 4"),"Task","08/05/2017","08/16/2017")
	// var_Items.ItemBarEx(true,545) = "#8/15/2017#"
	with (oG2antt)
		TemplateDef = [dim var_Items]
		TemplateDef = var_Items
		Template = [var_Items.ItemBarEx(True,545) = "#8/15/2017#"]
	endwith
oG2antt.EndUpdate()
|
|
1939
|
How do I move all bars to start at the same date-time
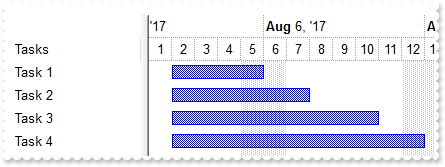
local oG2antt,var_Chart,var_Items

oG2antt = form.EXG2ANTTCHARTACTIVEXCONTROL1.nativeObject
oG2antt.BeginUpdate()
oG2antt.Columns.Add("Tasks")
var_Chart = oG2antt.Chart
	var_Chart.FirstVisibleDate = "08/01/2017"
	var_Chart.LevelCount = 2
	// var_Chart.PaneWidth(false) = 128
	with (oG2antt)
		TemplateDef = [dim var_Chart]
		TemplateDef = var_Chart
		Template = [var_Chart.PaneWidth(False) = 128]
	endwith
var_Items = oG2antt.Items
	var_Items.AddBar(var_Items.AddItem("Task 1"),"Task","08/02/2017","08/06/2017")
	var_Items.AddBar(var_Items.AddItem("Task 2"),"Task","08/03/2017","08/09/2017")
	var_Items.AddBar(var_Items.AddItem("Task 3"),"Task","08/04/2017","08/13/2017")
	var_Items.AddBar(var_Items.AddItem("Task 4"),"Task","08/05/2017","08/16/2017")
	// var_Items.ItemBarEx(true,544) = "#8/2/2017#"
	with (oG2antt)
		TemplateDef = [dim var_Items]
		TemplateDef = var_Items
		Template = [var_Items.ItemBarEx(True,544) = "#8/2/2017#"]
	endwith
oG2antt.EndUpdate()
|
|
1938
|
How do I apply a new color for some bars, while others should be shown with a different color
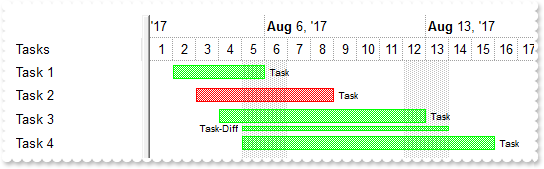
local h,oG2antt,var_Bar,var_Bar1,var_Chart,var_Items

oG2antt = form.EXG2ANTTCHARTACTIVEXCONTROL1.nativeObject
oG2antt.BeginUpdate()
oG2antt.Columns.Add("Tasks")
var_Chart = oG2antt.Chart
	var_Chart.FirstVisibleDate = "08/01/2017"
	var_Chart.LevelCount = 2
	// var_Chart.PaneWidth(false) = 128
	with (oG2antt)
		TemplateDef = [dim var_Chart]
		TemplateDef = var_Chart
		Template = [var_Chart.PaneWidth(False) = 128]
	endwith
	var_Chart.SelBackColor = 0xf0f0f0
	var_Bar = var_Chart.Bars.Item("Task")
		var_Bar.OverlaidType = 3
		var_Bar.OverlaidGroup = "Task,Task-Diff"
		// var_Bar.Def(3) = "<font ;6><%=%0%>"
		with (oG2antt)
			TemplateDef = [dim var_Bar]
			TemplateDef = var_Bar
			Template = [var_Bar.Def(3) = "<font ;6><%=%0%>"]
		endwith
		// var_Bar.Def(4) = 18
		with (oG2antt)
			TemplateDef = [dim var_Bar]
			TemplateDef = var_Bar
			Template = [var_Bar.Def(4) = 18]
		endwith
	var_Bar1 = var_Chart.Bars.Copy("Task","Task-Diff")
		var_Bar1.Height = 4
		var_Bar1.Color = 0xff
		// var_Bar1.Def(3) = "<font ;6><%=%0%>"
		with (oG2antt)
			TemplateDef = [dim var_Bar1]
			TemplateDef = var_Bar1
			Template = [var_Bar1.Def(3) = "<font ;6><%=%0%>"]
		endwith
		// var_Bar1.Def(4) = 16
		with (oG2antt)
			TemplateDef = [dim var_Bar1]
			TemplateDef = var_Bar1
			Template = [var_Bar1.Def(4) = 16]
		endwith
var_Items = oG2antt.Items
	var_Items.AddBar(var_Items.AddItem("Task 1"),"Task","08/02/2017","08/06/2017")
	var_Items.AddBar(var_Items.AddItem("Task 2"),"Task","08/03/2017","08/09/2017")
	h = var_Items.AddItem("Task 3")
	var_Items.AddBar(h,"Task","08/04/2017","08/13/2017","")
	var_Items.AddBar(h,"Task-Diff","08/05/2017","08/14/2017","P")
	var_Items.AddBar(var_Items.AddItem("Task 4"),"Task","08/05/2017","08/16/2017")
	// var_Items.ItemBarEx(true,33) = "cellcaption(0) like `*2` ? 0x0000FF : 0x00FF00"
	with (oG2antt)
		TemplateDef = [dim var_Items]
		TemplateDef = var_Items
		Template = [var_Items.ItemBarEx(True,33) = "cellcaption(0) like `*2` ? 0x0000FF : 0x00FF00"]
	endwith
oG2antt.EndUpdate()
|
|
1937
|
How do I hide some bars, and show others
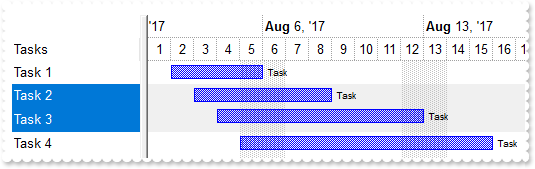
local h,oG2antt,var_Bar,var_Bar1,var_Chart,var_Items

oG2antt = form.EXG2ANTTCHARTACTIVEXCONTROL1.nativeObject
oG2antt.BeginUpdate()
oG2antt.SingleSel = false
oG2antt.Columns.Add("Tasks")
var_Chart = oG2antt.Chart
	var_Chart.FirstVisibleDate = "08/01/2017"
	var_Chart.LevelCount = 2
	// var_Chart.PaneWidth(false) = 128
	with (oG2antt)
		TemplateDef = [dim var_Chart]
		TemplateDef = var_Chart
		Template = [var_Chart.PaneWidth(False) = 128]
	endwith
	var_Chart.SelBackColor = 0xf0f0f0
	var_Bar = var_Chart.Bars.Item("Task")
		var_Bar.OverlaidType = 3
		var_Bar.OverlaidGroup = "Task,Task-Diff"
		// var_Bar.Def(3) = "<font ;6><%=%0%>"
		with (oG2antt)
			TemplateDef = [dim var_Bar]
			TemplateDef = var_Bar
			Template = [var_Bar.Def(3) = "<font ;6><%=%0%>"]
		endwith
		// var_Bar.Def(4) = 18
		with (oG2antt)
			TemplateDef = [dim var_Bar]
			TemplateDef = var_Bar
			Template = [var_Bar.Def(4) = 18]
		endwith
	var_Bar1 = var_Chart.Bars.Copy("Task","Task-Diff")
		var_Bar1.Height = 4
		var_Bar1.Color = 0xff
		// var_Bar1.Def(3) = "<font ;6><%=%0%>"
		with (oG2antt)
			TemplateDef = [dim var_Bar1]
			TemplateDef = var_Bar1
			Template = [var_Bar1.Def(3) = "<font ;6><%=%0%>"]
		endwith
		// var_Bar1.Def(4) = 16
		with (oG2antt)
			TemplateDef = [dim var_Bar1]
			TemplateDef = var_Bar1
			Template = [var_Bar1.Def(4) = 16]
		endwith
var_Items = oG2antt.Items
	var_Items.AddBar(var_Items.AddItem("Task 1"),"Task","08/02/2017","08/06/2017")
	h = var_Items.AddItem("Task 2")
	var_Items.AddBar(h,"Task","08/03/2017","08/09/2017")
	// var_Items.SelectItem(h) = true
	with (oG2antt)
		TemplateDef = [dim var_Items,h]
		TemplateDef = var_Items
		TemplateDef = h
		Template = [var_Items.SelectItem(h) = True]
	endwith
	h = var_Items.AddItem("Task 3")
	var_Items.AddBar(h,"Task","08/04/2017","08/13/2017","")
	var_Items.AddBar(h,"Task-Diff","08/05/2017","08/14/2017","P")
	// var_Items.SelectItem(h) = true
	with (oG2antt)
		TemplateDef = [dim var_Items,h]
		TemplateDef = var_Items
		TemplateDef = h
		Template = [var_Items.SelectItem(h) = True]
	endwith
	var_Items.AddBar(var_Items.AddItem("Task 4"),"Task","08/05/2017","08/16/2017")
	// var_Items.ItemBarEx("-1",19) = "itembar(0) = `Task` ? 0 : 100"
	with (oG2antt)
		TemplateDef = [dim var_Items]
		TemplateDef = var_Items
		Template = [var_Items.ItemBarEx("-1",19) = "itembar(0) = `Task` ? 0 : 100"]
	endwith
oG2antt.EndUpdate()
|
|
1936
|
I like how ItemBarEx works, the question is how can I remove the bars based on the same criteria
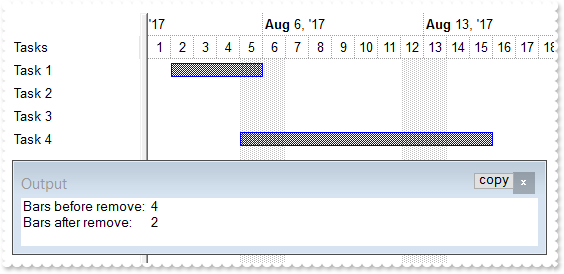
local oG2antt,var_Chart,var_Items

oG2antt = form.EXG2ANTTCHARTACTIVEXCONTROL1.nativeObject
oG2antt.BeginUpdate()
oG2antt.Columns.Add("Tasks")
var_Chart = oG2antt.Chart
	var_Chart.FirstVisibleDate = "08/01/2017"
	var_Chart.LevelCount = 2
	// var_Chart.PaneWidth(false) = 128
	with (oG2antt)
		TemplateDef = [dim var_Chart]
		TemplateDef = var_Chart
		Template = [var_Chart.PaneWidth(False) = 128]
	endwith
var_Items = oG2antt.Items
	var_Items.AddBar(var_Items.AddItem("Task 1"),"Task","08/02/2017","08/06/2017")
	var_Items.AddBar(var_Items.AddItem("Task 2"),"Task","08/03/2017","08/09/2017")
	var_Items.AddBar(var_Items.AddItem("Task 3"),"Task","08/04/2017","08/13/2017")
	var_Items.AddBar(var_Items.AddItem("Task 4"),"Task","08/05/2017","08/16/2017")
	? "Bars before remove: "
	? Str(var_Items.ItemBar(0,"<*>",256))
	// var_Items.ItemBarEx("cellcaption(0) like `*2 *3`",9) = "`toberemove` + value "
	with (oG2antt)
		TemplateDef = [dim var_Items]
		TemplateDef = var_Items
		Template = [var_Items.ItemBarEx("cellcaption(0) like `*2 *3`",9) = "`toberemove` + value "]
	endwith
	var_Items.RemoveBar(0,"<toberemove*>")
	? "Bars after remove: "
	? Str(var_Items.ItemBar(0,"<*>",256))
oG2antt.EndUpdate()
|
|
1935
|
Is it possible to automatically color the bar being checked
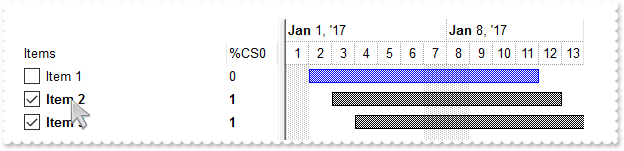
/*
with (this.EXG2ANTTCHARTACTIVEXCONTROL1.nativeObject)
	CellStateChanged = class::nativeObject_CellStateChanged
endwith
*/
// Fired after cell's state has been changed.
function nativeObject_CellStateChanged(Item, ColIndex)
	oG2antt = form.EXG2ANTTCHARTACTIVEXCONTROL1.nativeObject
return

local h,oG2antt,var_Chart,var_Column,var_Column1,var_ConditionalFormat,var_Items

oG2antt = form.EXG2ANTTCHARTACTIVEXCONTROL1.nativeObject
oG2antt.BeginUpdate()
oG2antt.SelBackMode = 1
var_Chart = oG2antt.Chart
	var_Chart.LevelCount = 2
	// var_Chart.PaneWidth(false) = 256
	with (oG2antt)
		TemplateDef = [dim var_Chart]
		TemplateDef = var_Chart
		Template = [var_Chart.PaneWidth(False) = 256]
	endwith
	var_Chart.FirstVisibleDate = "01/01/2017"
var_ConditionalFormat = oG2antt.ConditionalFormats.Add("%CS0","check")
	var_ConditionalFormat.Bold = true
	var_ConditionalFormat.ApplyToBars = "Task"
	var_ConditionalFormat.BarColor = 0x10000
var_Column = oG2antt.Columns.Add("Items")
	// var_Column.Def(0) = true
	with (oG2antt)
		TemplateDef = [dim var_Column]
		TemplateDef = var_Column
		Template = [var_Column.Def(0) = True]
	endwith
	var_Column.Width = 256
// oG2antt.Columns.Add(oG2antt.ConditionalFormats.Item("check").Expression).FormatColumn = oG2antt.ConditionalFormats.Item("check").Expression
var_Column1 = oG2antt.Columns.Add(oG2antt.ConditionalFormats.Item("check").Expression)
with (oG2antt)
	TemplateDef = [dim var_Column1]
	TemplateDef = var_Column1
	Template = [var_Column1.FormatColumn = Me.ConditionalFormats.Item("check").Expression]
endwith
var_Items = oG2antt.Items
	var_Items.AddBar(var_Items.AddItem("Item 1"),"Task","01/02/2017","01/12/2017")
	h = var_Items.AddItem("Item 2")
	var_Items.AddBar(h,"Task","01/03/2017","01/13/2017")
	// var_Items.CellState(h,0) = 1
	with (oG2antt)
		TemplateDef = [dim var_Items,h]
		TemplateDef = var_Items
		TemplateDef = h
		Template = [var_Items.CellState(h,0) = 1]
	endwith
	h = var_Items.AddItem("Item 3")
	var_Items.AddBar(h,"Task","01/04/2017","01/14/2017")
	// var_Items.CellState(h,0) = 1
	with (oG2antt)
		TemplateDef = [dim var_Items,h]
		TemplateDef = var_Items
		TemplateDef = h
		Template = [var_Items.CellState(h,0) = 1]
	endwith
oG2antt.EndUpdate()
|
|
1934
|
How do I automatically bold items being checked
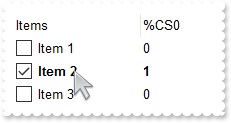
/*
with (this.EXG2ANTTCHARTACTIVEXCONTROL1.nativeObject)
	CellStateChanged = class::nativeObject_CellStateChanged
endwith
*/
// Fired after cell's state has been changed.
function nativeObject_CellStateChanged(Item, ColIndex)
	oG2antt = form.EXG2ANTTCHARTACTIVEXCONTROL1.nativeObject
return

local oG2antt,var_Chart,var_Column,var_Column1,var_ConditionalFormat,var_Items

oG2antt = form.EXG2ANTTCHARTACTIVEXCONTROL1.nativeObject
oG2antt.BeginUpdate()
oG2antt.SelBackMode = 1
// oG2antt.Chart.PaneWidth(true) = 0
var_Chart = oG2antt.Chart
with (oG2antt)
	TemplateDef = [dim var_Chart]
	TemplateDef = var_Chart
	Template = [var_Chart.PaneWidth(True) = 0]
endwith
var_ConditionalFormat = oG2antt.ConditionalFormats.Add("%CS0","check")
	var_ConditionalFormat.Bold = true
// oG2antt.Columns.Add("Items").Def(0) = true
var_Column = oG2antt.Columns.Add("Items")
with (oG2antt)
	TemplateDef = [dim var_Column]
	TemplateDef = var_Column
	Template = [var_Column.Def(0) = True]
endwith
// oG2antt.Columns.Add(oG2antt.ConditionalFormats.Item("check").Expression).FormatColumn = oG2antt.ConditionalFormats.Item("check").Expression
var_Column1 = oG2antt.Columns.Add(oG2antt.ConditionalFormats.Item("check").Expression)
with (oG2antt)
	TemplateDef = [dim var_Column1]
	TemplateDef = var_Column1
	Template = [var_Column1.FormatColumn = Me.ConditionalFormats.Item("check").Expression]
endwith
var_Items = oG2antt.Items
	var_Items.AddItem("Item 1")
	// var_Items.CellState(var_Items.AddItem("Item 2"),0) = 1
	with (oG2antt)
		TemplateDef = [dim var_Items]
		TemplateDef = var_Items
		Template = [var_Items.CellState(AddItem("Item 2"),0) = 1]
	endwith
	var_Items.AddItem("Item 3")
oG2antt.EndUpdate()
|
|
1933
|
Can I display the radio-button with a solid color
local oG2antt,var_Chart,var_Column,var_Items

oG2antt = form.EXG2ANTTCHARTACTIVEXCONTROL1.nativeObject
oG2antt.BeginUpdate()
// oG2antt.Chart.PaneWidth(true) = 0
var_Chart = oG2antt.Chart
with (oG2antt)
	TemplateDef = [dim var_Chart]
	TemplateDef = var_Chart
	Template = [var_Chart.PaneWidth(True) = 0]
endwith
oG2antt.Template = [RadioImage(0) = 32699122] // oG2antt.RadioImage(false) = 32699122
oG2antt.Template = [RadioImage(1) = 16777216] // oG2antt.RadioImage(true) = 16777216
// oG2antt.Columns.Add("Check").Def(1) = true
var_Column = oG2antt.Columns.Add("Check")
with (oG2antt)
	TemplateDef = [dim var_Column]
	TemplateDef = var_Column
	Template = [var_Column.Def(1) = True]
endwith
var_Items = oG2antt.Items
	var_Items.AddItem("Radio 1")
	// var_Items.CellState(var_Items.AddItem("Radio 2"),0) = 1
	with (oG2antt)
		TemplateDef = [dim var_Items]
		TemplateDef = var_Items
		Template = [var_Items.CellState(AddItem("Radio 2"),0) = 1]
	endwith
	var_Items.AddItem("Radio 1")
oG2antt.EndUpdate()
|
|
1932
|
Can I display the check-box with a solid color
local oG2antt,var_Chart,var_Column,var_Items

oG2antt = form.EXG2ANTTCHARTACTIVEXCONTROL1.nativeObject
oG2antt.BeginUpdate()
// oG2antt.Chart.PaneWidth(true) = 0
var_Chart = oG2antt.Chart
with (oG2antt)
	TemplateDef = [dim var_Chart]
	TemplateDef = var_Chart
	Template = [var_Chart.PaneWidth(True) = 0]
endwith
oG2antt.Template = [CheckImage(0) = 32699122] // oG2antt.CheckImage(0) = 32699122
oG2antt.Template = [CheckImage(1) = 16777216] // oG2antt.CheckImage(1) = 16777216
// oG2antt.Columns.Add("Check").Def(0) = true
var_Column = oG2antt.Columns.Add("Check")
with (oG2antt)
	TemplateDef = [dim var_Column]
	TemplateDef = var_Column
	Template = [var_Column.Def(0) = True]
endwith
var_Items = oG2antt.Items
	var_Items.AddItem("Check 1")
	// var_Items.CellState(var_Items.AddItem("Check 2"),0) = 1
	with (oG2antt)
		TemplateDef = [dim var_Items]
		TemplateDef = var_Items
		Template = [var_Items.CellState(AddItem("Check 2"),0) = 1]
	endwith
	var_Items.AddItem("Check 3")
oG2antt.EndUpdate()
|
|
1931
|
How can I use the CellState with ConditionalFormat/ComputedField/FormatColumn
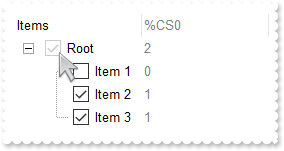
/*
with (this.EXG2ANTTCHARTACTIVEXCONTROL1.nativeObject)
	CellStateChanged = class::nativeObject_CellStateChanged
endwith
*/
// Fired after cell's state has been changed.
function nativeObject_CellStateChanged(Item, ColIndex)
	oG2antt = form.EXG2ANTTCHARTACTIVEXCONTROL1.nativeObject
return

local h,oG2antt,var_Chart,var_Column,var_Column1,var_Items

oG2antt = form.EXG2ANTTCHARTACTIVEXCONTROL1.nativeObject
oG2antt.BeginUpdate()
oG2antt.LinesAtRoot = 4
oG2antt.SelBackMode = 1
// oG2antt.Chart.PaneWidth(true) = 0
var_Chart = oG2antt.Chart
with (oG2antt)
	TemplateDef = [dim var_Chart]
	TemplateDef = var_Chart
	Template = [var_Chart.PaneWidth(True) = 0]
endwith
var_Column = oG2antt.Columns.Add("Items")
	// var_Column.Def(0) = true
	with (oG2antt)
		TemplateDef = [dim var_Column]
		TemplateDef = var_Column
		Template = [var_Column.Def(0) = True]
	endwith
	var_Column.PartialCheck = true
var_Column1 = oG2antt.Columns.Add("Format")
	var_Column1.FormatColumn = "%CS0"
	var_Column1.Caption = var_Column1.FormatColumn
	// var_Column1.Def(5) = 8421504
	with (oG2antt)
		TemplateDef = [dim var_Column1]
		TemplateDef = var_Column1
		Template = [var_Column1.Def(5) = 8421504]
	endwith
	// var_Column1.Def(8) = var_Column1.Def(5)
	with (oG2antt)
		TemplateDef = [dim var_Column1]
		TemplateDef = var_Column1
		Template = [var_Column1.Def(8) = Def(5)]
	endwith
var_Items = oG2antt.Items
	h = var_Items.AddItem("Root")
	var_Items.InsertItem(h,null,"Item 1")
	// var_Items.CellState(var_Items.InsertItem(h,null,"Item 2"),0) = 1
	with (oG2antt)
		TemplateDef = [dim var_Items]
		TemplateDef = var_Items
		Template = [var_Items.CellState(InsertItem(h,,"Item 2"),0) = 1]
	endwith
	// var_Items.CellState(var_Items.InsertItem(h,null,"Item 3"),0) = 1
	with (oG2antt)
		TemplateDef = [dim var_Items]
		TemplateDef = var_Items
		Template = [var_Items.CellState(InsertItem(h,,"Item 3"),0) = 1]
	endwith
	// var_Items.ExpandItem(h) = true
	with (oG2antt)
		TemplateDef = [dim var_Items,h]
		TemplateDef = var_Items
		TemplateDef = h
		Template = [var_Items.ExpandItem(h) = True]
	endwith
oG2antt.EndUpdate()
|
|
1930
|
How can I use the CellData with ConditionalFormat/ComputedField/FormatColumn
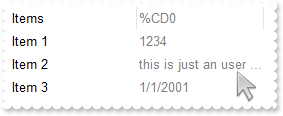
local oG2antt,var_Chart,var_Column,var_Items

oG2antt = form.EXG2ANTTCHARTACTIVEXCONTROL1.nativeObject
oG2antt.BeginUpdate()
// oG2antt.Chart.PaneWidth(true) = 0
var_Chart = oG2antt.Chart
with (oG2antt)
	TemplateDef = [dim var_Chart]
	TemplateDef = var_Chart
	Template = [var_Chart.PaneWidth(True) = 0]
endwith
oG2antt.Columns.Add("Items")
var_Column = oG2antt.Columns.Add("Format")
	var_Column.FormatColumn = "%CD0"
	var_Column.Caption = var_Column.FormatColumn
	// var_Column.Def(5) = 8421504
	with (oG2antt)
		TemplateDef = [dim var_Column]
		TemplateDef = var_Column
		Template = [var_Column.Def(5) = 8421504]
	endwith
	// var_Column.Def(8) = var_Column.Def(5)
	with (oG2antt)
		TemplateDef = [dim var_Column]
		TemplateDef = var_Column
		Template = [var_Column.Def(8) = Def(5)]
	endwith
var_Items = oG2antt.Items
	// var_Items.CellData(var_Items.AddItem("Item 1"),0) = 1234
	with (oG2antt)
		TemplateDef = [dim var_Items]
		TemplateDef = var_Items
		Template = [var_Items.CellData(AddItem("Item 1"),0) = 1234]
	endwith
	// var_Items.CellData(var_Items.AddItem("Item 2"),0) = "this is just an user data"
	with (oG2antt)
		TemplateDef = [dim var_Items]
		TemplateDef = var_Items
		Template = [var_Items.CellData(AddItem("Item 2"),0) = "this is just an user data"]
	endwith
	// var_Items.CellData(var_Items.AddItem("Item 3"),0) = "01/01/2001"
	with (oG2antt)
		TemplateDef = [dim var_Items]
		TemplateDef = var_Items
		Template = [var_Items.CellData(AddItem("Item 3"),0) = #1/1/2001#]
	endwith
oG2antt.EndUpdate()
|
|
1929
|
How can I use the CellValue/CellCaption with ConditionalFormat/ComputedField/FormatColumn
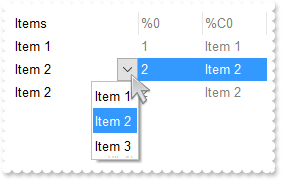
local oG2antt,var_Chart,var_Column,var_Column1,var_Column2,var_Editor,var_Items

oG2antt = form.EXG2ANTTCHARTACTIVEXCONTROL1.nativeObject
oG2antt.BeginUpdate()
// oG2antt.Chart.PaneWidth(true) = 0
var_Chart = oG2antt.Chart
with (oG2antt)
	TemplateDef = [dim var_Chart]
	TemplateDef = var_Chart
	Template = [var_Chart.PaneWidth(True) = 0]
endwith
var_Column = oG2antt.Columns.Add("Items")
	var_Editor = var_Column.Editor
		var_Editor.EditType = 3
		var_Editor.AddItem(1,"Item 1")
		var_Editor.AddItem(2,"Item 2")
		var_Editor.AddItem(3,"Item 3")
var_Column1 = oG2antt.Columns.Add("Format")
	var_Column1.FormatColumn = "%0"
	var_Column1.Caption = var_Column1.FormatColumn
	// var_Column1.Def(5) = 8421504
	with (oG2antt)
		TemplateDef = [dim var_Column1]
		TemplateDef = var_Column1
		Template = [var_Column1.Def(5) = 8421504]
	endwith
	// var_Column1.Def(8) = var_Column1.Def(5)
	with (oG2antt)
		TemplateDef = [dim var_Column1]
		TemplateDef = var_Column1
		Template = [var_Column1.Def(8) = Def(5)]
	endwith
	var_Column1.AllowSizing = false
var_Column2 = oG2antt.Columns.Add("Format")
	var_Column2.FormatColumn = "%C0"
	var_Column2.Caption = var_Column2.FormatColumn
	// var_Column2.Def(5) = 8421504
	with (oG2antt)
		TemplateDef = [dim var_Column2]
		TemplateDef = var_Column2
		Template = [var_Column2.Def(5) = 8421504]
	endwith
	// var_Column2.Def(8) = var_Column2.Def(5)
	with (oG2antt)
		TemplateDef = [dim var_Column2]
		TemplateDef = var_Column2
		Template = [var_Column2.Def(8) = Def(5)]
	endwith
	var_Column2.AllowSizing = false
var_Items = oG2antt.Items
	var_Items.AddItem(1)
	// var_Items.CellValue(var_Items.AddItem(0),0) = 2
	with (oG2antt)
		TemplateDef = [dim var_Items]
		TemplateDef = var_Items
		Template = [var_Items.CellValue(AddItem(0),0) = 2]
	endwith
	var_Items.AddItem(2)
oG2antt.EndUpdate()
|
|
1928
|
How can I use the ShowNonworkingHours property (hide the non-working hours)
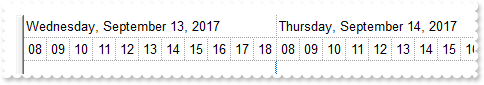
local oG2antt,var_Chart

oG2antt = form.EXG2ANTTCHARTACTIVEXCONTROL1.nativeObject
oG2antt.BeginUpdate()
var_Chart = oG2antt.Chart
	// var_Chart.PaneWidth(false) = 0
	with (oG2antt)
		TemplateDef = [dim var_Chart]
		TemplateDef = var_Chart
		Template = [var_Chart.PaneWidth(False) = 0]
	endwith
	var_Chart.LevelCount = 2
	var_Chart.UnitScale = 65536
	var_Chart.NonworkingHours = 16253183
	var_Chart.ShowNonworkingHours = false
	var_Chart.ShowNonworkingUnits = false
oG2antt.EndUpdate()
|
|
1927
|
How can I use the ShowNonworkingDates property (hide the non-working days)
local oG2antt,var_Chart

oG2antt = form.EXG2ANTTCHARTACTIVEXCONTROL1.nativeObject
oG2antt.BeginUpdate()
var_Chart = oG2antt.Chart
	// var_Chart.PaneWidth(false) = 0
	with (oG2antt)
		TemplateDef = [dim var_Chart]
		TemplateDef = var_Chart
		Template = [var_Chart.PaneWidth(False) = 0]
	endwith
	var_Chart.LevelCount = 2
	var_Chart.UnitScale = 4096
	var_Chart.ShowNonworkingDates = false
	var_Chart.ShowNonworkingUnits = false
oG2antt.EndUpdate()
|
|
1926
|
How can I show/hide bars once the user checks or un-checks a column
/*
with (this.EXG2ANTTCHARTACTIVEXCONTROL1.nativeObject)
	CellStateChanged = class::nativeObject_CellStateChanged
endwith
*/
// Fired after cell's state has been changed.
function nativeObject_CellStateChanged(Item, ColIndex)
	local var_Items
	oG2antt = form.EXG2ANTTCHARTACTIVEXCONTROL1.nativeObject
	var_Items = oG2antt.Items
		// var_Items.ItemBarEx(true,19) = "cellstate(0) = 1 ? 0 : 100"
		with (oG2antt)
			TemplateDef = [dim var_Items]
			TemplateDef = var_Items
			Template = [var_Items.ItemBarEx(True,19) = "cellstate(0) = 1 ? 0 : 100"]
		endwith
return

local h,hChild,oG2antt,var_Bar,var_Chart,var_Column,var_Items

oG2antt = form.EXG2ANTTCHARTACTIVEXCONTROL1.nativeObject
oG2antt.BeginUpdate()
oG2antt.LinesAtRoot = -1
var_Column = oG2antt.Columns.Add("Tasks")
	// var_Column.Def(0) = true
	with (oG2antt)
		TemplateDef = [dim var_Column]
		TemplateDef = var_Column
		Template = [var_Column.Def(0) = True]
	endwith
	var_Column.PartialCheck = true
oG2antt.HeaderVisible = 1
oG2antt.SelBackColor = 0xf0f0f0
oG2antt.SelForeColor = 0x0
var_Chart = oG2antt.Chart
	var_Chart.FirstVisibleDate = "08/01/2017"
	var_Chart.LevelCount = 2
	// var_Chart.PaneWidth(false) = 128
	with (oG2antt)
		TemplateDef = [dim var_Chart]
		TemplateDef = var_Chart
		Template = [var_Chart.PaneWidth(False) = 128]
	endwith
	var_Bar = var_Chart.Bars.Item("Summary")
		var_Bar.StartShape = 0
		var_Bar.EndShape = 0
		var_Bar.Shape = 20
	var_Chart.SelBackColor = oG2antt.SelBackColor
	var_Chart.SelBarColor = 0x808080
var_Items = oG2antt.Items
	h = var_Items.AddItem("Project")
	hChild = var_Items.InsertItem(h,null,"Task 1")
	var_Items.AddBar(hChild,"Task","08/02/2017","08/08/2017")
	// var_Items.SelectItem(hChild) = true
	with (oG2antt)
		TemplateDef = [dim var_Items,hChild]
		TemplateDef = var_Items
		TemplateDef = hChild
		Template = [var_Items.SelectItem(hChild) = True]
	endwith
	hChild = var_Items.InsertItem(h,null,"Task 2")
	var_Items.AddBar(hChild,"Task","08/03/2017","08/10/2017")
	// var_Items.CellState(hChild,0) = 1
	with (oG2antt)
		TemplateDef = [dim var_Items,hChild]
		TemplateDef = var_Items
		TemplateDef = hChild
		Template = [var_Items.CellState(hChild,0) = 1]
	endwith
	hChild = var_Items.InsertItem(h,null,"Task 3")
	var_Items.AddBar(hChild,"Task","08/04/2017","08/12/2017")
	var_Items.AddBar(h,"Summary","08/01/2017","08/01/2017","sum")
	var_Items.DefineSummaryBars(h,"sum",-3,"")
	// var_Items.ExpandItem(h) = true
	with (oG2antt)
		TemplateDef = [dim var_Items,h]
		TemplateDef = var_Items
		TemplateDef = h
		Template = [var_Items.ExpandItem(h) = True]
	endwith
	// var_Items.ItemBarEx(true,19) = "cellstate(0) = 1 ? 0 : 100"
	with (oG2antt)
		TemplateDef = [dim var_Items]
		TemplateDef = var_Items
		Template = [var_Items.ItemBarEx(True,19) = "cellstate(0) = 1 ? 0 : 100"]
	endwith
oG2antt.EndUpdate()
|
|
1925
|
How can I change the color for all Task bars
local h,hChild,oG2antt,var_Bar,var_Chart,var_Column,var_Items

oG2antt = form.EXG2ANTTCHARTACTIVEXCONTROL1.nativeObject
oG2antt.BeginUpdate()
oG2antt.LinesAtRoot = -1
var_Column = oG2antt.Columns.Add("Tasks")
	// var_Column.Def(0) = true
	with (oG2antt)
		TemplateDef = [dim var_Column]
		TemplateDef = var_Column
		Template = [var_Column.Def(0) = True]
	endwith
	var_Column.PartialCheck = true
oG2antt.HeaderVisible = 1
oG2antt.SelBackColor = 0xf0f0f0
oG2antt.SelForeColor = 0x0
var_Chart = oG2antt.Chart
	var_Chart.FirstVisibleDate = "08/01/2017"
	var_Chart.LevelCount = 2
	// var_Chart.PaneWidth(false) = 128
	with (oG2antt)
		TemplateDef = [dim var_Chart]
		TemplateDef = var_Chart
		Template = [var_Chart.PaneWidth(False) = 128]
	endwith
	var_Bar = var_Chart.Bars.Item("Summary")
		var_Bar.StartShape = 0
		var_Bar.EndShape = 0
		var_Bar.Shape = 20
	var_Chart.SelBackColor = oG2antt.SelBackColor
	var_Chart.SelBarColor = 0x808080
var_Items = oG2antt.Items
	h = var_Items.AddItem("Project")
	hChild = var_Items.InsertItem(h,null,"Task 1")
	var_Items.AddBar(hChild,"Task","08/02/2017","08/08/2017")
	// var_Items.SelectItem(hChild) = true
	with (oG2antt)
		TemplateDef = [dim var_Items,hChild]
		TemplateDef = var_Items
		TemplateDef = hChild
		Template = [var_Items.SelectItem(hChild) = True]
	endwith
	hChild = var_Items.InsertItem(h,null,"Task 2")
	var_Items.AddBar(hChild,"Task","08/03/2017","08/10/2017")
	// var_Items.CellState(hChild,0) = 1
	with (oG2antt)
		TemplateDef = [dim var_Items,hChild]
		TemplateDef = var_Items
		TemplateDef = hChild
		Template = [var_Items.CellState(hChild,0) = 1]
	endwith
	hChild = var_Items.InsertItem(h,null,"Task 3")
	var_Items.AddBar(hChild,"Task","08/04/2017","08/12/2017")
	// var_Items.CellState(hChild,0) = 1
	with (oG2antt)
		TemplateDef = [dim var_Items,hChild]
		TemplateDef = var_Items
		TemplateDef = hChild
		Template = [var_Items.CellState(hChild,0) = 1]
	endwith
	var_Items.AddBar(h,"Summary","08/01/2017","08/01/2017","sum")
	var_Items.DefineSummaryBars(h,"sum",-3,"")
	// var_Items.ExpandItem(h) = true
	with (oG2antt)
		TemplateDef = [dim var_Items,h]
		TemplateDef = var_Items
		TemplateDef = h
		Template = [var_Items.ExpandItem(h) = True]
	endwith
	// var_Items.ItemBarEx("itembar(0) = `Task`",33) = 65280
	with (oG2antt)
		TemplateDef = [dim var_Items]
		TemplateDef = var_Items
		Template = [var_Items.ItemBarEx("itembar(0) = `Task`",33) = 65280]
	endwith
oG2antt.EndUpdate()
|
|
1924
|
Is it possible to automatically select bars only when user selects a new item
/*
with (this.EXG2ANTTCHARTACTIVEXCONTROL1.nativeObject)
	SelectionChanged = class::nativeObject_SelectionChanged
endwith
*/
// Fired after a new item has been selected.
function nativeObject_SelectionChanged()
	local var_Items
	oG2antt = form.EXG2ANTTCHARTACTIVEXCONTROL1.nativeObject
	var_Items = oG2antt.Items
		// var_Items.ItemBarEx(true,257) = "itemisselected"
		with (oG2antt)
			TemplateDef = [dim var_Items]
			TemplateDef = var_Items
			Template = [var_Items.ItemBarEx(True,257) = "itemisselected"]
		endwith
return

local h,hChild,oG2antt,var_Bar,var_Chart,var_Items

oG2antt = form.EXG2ANTTCHARTACTIVEXCONTROL1.nativeObject
oG2antt.BeginUpdate()
oG2antt.LinesAtRoot = -1
oG2antt.Columns.Add("Tasks")
oG2antt.HeaderVisible = 1
oG2antt.SelBackColor = 0xf0f0f0
oG2antt.SelForeColor = 0x0
var_Chart = oG2antt.Chart
	var_Chart.AllowSelectObjects = 0
	var_Chart.FirstVisibleDate = "08/01/2017"
	var_Chart.LevelCount = 2
	// var_Chart.PaneWidth(false) = 128
	with (oG2antt)
		TemplateDef = [dim var_Chart]
		TemplateDef = var_Chart
		Template = [var_Chart.PaneWidth(False) = 128]
	endwith
	var_Bar = var_Chart.Bars.Item("Summary")
		var_Bar.StartShape = 0
		var_Bar.EndShape = 0
		var_Bar.Shape = 20
	var_Chart.SelBackColor = oG2antt.SelBackColor
	var_Chart.SelBarColor = 0x808080
var_Items = oG2antt.Items
	h = var_Items.AddItem("Project")
	hChild = var_Items.InsertItem(h,null,"Task 1")
	var_Items.AddBar(hChild,"Task","08/02/2017","08/08/2017")
	// var_Items.SelectItem(hChild) = true
	with (oG2antt)
		TemplateDef = [dim var_Items,hChild]
		TemplateDef = var_Items
		TemplateDef = hChild
		Template = [var_Items.SelectItem(hChild) = True]
	endwith
	hChild = var_Items.InsertItem(h,null,"Task 2")
	var_Items.AddBar(hChild,"Task","08/03/2017","08/10/2017")
	// var_Items.CellState(hChild,0) = 1
	with (oG2antt)
		TemplateDef = [dim var_Items,hChild]
		TemplateDef = var_Items
		TemplateDef = hChild
		Template = [var_Items.CellState(hChild,0) = 1]
	endwith
	hChild = var_Items.InsertItem(h,null,"Task 3")
	var_Items.AddBar(hChild,"Task","08/04/2017","08/12/2017")
	// var_Items.CellState(hChild,0) = 1
	with (oG2antt)
		TemplateDef = [dim var_Items,hChild]
		TemplateDef = var_Items
		TemplateDef = hChild
		Template = [var_Items.CellState(hChild,0) = 1]
	endwith
	var_Items.AddBar(h,"Summary","08/01/2017","08/01/2017","sum")
	var_Items.DefineSummaryBars(h,"sum",-3,"")
	// var_Items.ExpandItem(h) = true
	with (oG2antt)
		TemplateDef = [dim var_Items,h]
		TemplateDef = var_Items
		TemplateDef = h
		Template = [var_Items.ExpandItem(h) = True]
	endwith
oG2antt.EndUpdate()
|
|
1923
|
Is it possible to automatically select bars only when the user clicks the column's checkbox
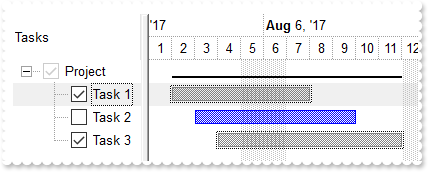
/*
with (this.EXG2ANTTCHARTACTIVEXCONTROL1.nativeObject)
	CellStateChanged = class::nativeObject_CellStateChanged
endwith
*/
// Fired after cell's state has been changed.
function nativeObject_CellStateChanged(Item, ColIndex)
	local var_Items
	oG2antt = form.EXG2ANTTCHARTACTIVEXCONTROL1.nativeObject
	var_Items = oG2antt.Items
		// var_Items.ItemBarEx(true,257) = "cellstate(0) = 1"
		with (oG2antt)
			TemplateDef = [dim var_Items]
			TemplateDef = var_Items
			Template = [var_Items.ItemBarEx(True,257) = "cellstate(0) = 1"]
		endwith
return

local h,hChild,oG2antt,var_Bar,var_Chart,var_Column,var_Items

oG2antt = form.EXG2ANTTCHARTACTIVEXCONTROL1.nativeObject
oG2antt.BeginUpdate()
oG2antt.LinesAtRoot = -1
var_Column = oG2antt.Columns.Add("Tasks")
	// var_Column.Def(0) = true
	with (oG2antt)
		TemplateDef = [dim var_Column]
		TemplateDef = var_Column
		Template = [var_Column.Def(0) = True]
	endwith
	var_Column.PartialCheck = true
oG2antt.HeaderVisible = 1
oG2antt.SelBackColor = 0xf0f0f0
oG2antt.SelForeColor = 0x0
var_Chart = oG2antt.Chart
	var_Chart.AllowSelectObjects = 0
	var_Chart.FirstVisibleDate = "08/01/2017"
	var_Chart.LevelCount = 2
	// var_Chart.PaneWidth(false) = 128
	with (oG2antt)
		TemplateDef = [dim var_Chart]
		TemplateDef = var_Chart
		Template = [var_Chart.PaneWidth(False) = 128]
	endwith
	var_Bar = var_Chart.Bars.Item("Summary")
		var_Bar.StartShape = 0
		var_Bar.EndShape = 0
		var_Bar.Shape = 20
	var_Chart.SelBackColor = oG2antt.SelBackColor
	var_Chart.SelBarColor = 0x808080
var_Items = oG2antt.Items
	h = var_Items.AddItem("Project")
	hChild = var_Items.InsertItem(h,null,"Task 1")
	var_Items.AddBar(hChild,"Task","08/02/2017","08/08/2017")
	// var_Items.SelectItem(hChild) = true
	with (oG2antt)
		TemplateDef = [dim var_Items,hChild]
		TemplateDef = var_Items
		TemplateDef = hChild
		Template = [var_Items.SelectItem(hChild) = True]
	endwith
	hChild = var_Items.InsertItem(h,null,"Task 2")
	var_Items.AddBar(hChild,"Task","08/03/2017","08/10/2017")
	// var_Items.CellState(hChild,0) = 1
	with (oG2antt)
		TemplateDef = [dim var_Items,hChild]
		TemplateDef = var_Items
		TemplateDef = hChild
		Template = [var_Items.CellState(hChild,0) = 1]
	endwith
	hChild = var_Items.InsertItem(h,null,"Task 3")
	var_Items.AddBar(hChild,"Task","08/04/2017","08/12/2017")
	// var_Items.CellState(hChild,0) = 1
	with (oG2antt)
		TemplateDef = [dim var_Items,hChild]
		TemplateDef = var_Items
		TemplateDef = hChild
		Template = [var_Items.CellState(hChild,0) = 1]
	endwith
	var_Items.AddBar(h,"Summary","08/01/2017","08/01/2017","sum")
	var_Items.DefineSummaryBars(h,"sum",-3,"")
	// var_Items.ExpandItem(h) = true
	with (oG2antt)
		TemplateDef = [dim var_Items,h]
		TemplateDef = var_Items
		TemplateDef = h
		Template = [var_Items.ExpandItem(h) = True]
	endwith
oG2antt.EndUpdate()
|
|
1922
|
How do I select all bars on leaf items
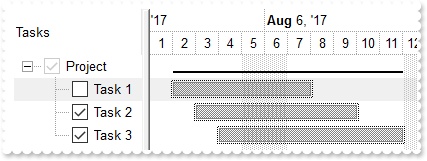
local h,hChild,oG2antt,var_Bar,var_Chart,var_Column,var_Items

oG2antt = form.EXG2ANTTCHARTACTIVEXCONTROL1.nativeObject
oG2antt.BeginUpdate()
oG2antt.LinesAtRoot = -1
var_Column = oG2antt.Columns.Add("Tasks")
	// var_Column.Def(0) = true
	with (oG2antt)
		TemplateDef = [dim var_Column]
		TemplateDef = var_Column
		Template = [var_Column.Def(0) = True]
	endwith
	var_Column.PartialCheck = true
oG2antt.HeaderVisible = 1
oG2antt.SelBackColor = 0xf0f0f0
oG2antt.SelForeColor = 0x0
var_Chart = oG2antt.Chart
	var_Chart.FirstVisibleDate = "08/01/2017"
	var_Chart.LevelCount = 2
	// var_Chart.PaneWidth(false) = 128
	with (oG2antt)
		TemplateDef = [dim var_Chart]
		TemplateDef = var_Chart
		Template = [var_Chart.PaneWidth(False) = 128]
	endwith
	var_Bar = var_Chart.Bars.Item("Summary")
		var_Bar.StartShape = 0
		var_Bar.EndShape = 0
		var_Bar.Shape = 20
	var_Chart.SelBackColor = oG2antt.SelBackColor
	var_Chart.SelBarColor = 0x808080
var_Items = oG2antt.Items
	h = var_Items.AddItem("Project")
	hChild = var_Items.InsertItem(h,null,"Task 1")
	var_Items.AddBar(hChild,"Task","08/02/2017","08/08/2017")
	// var_Items.SelectItem(hChild) = true
	with (oG2antt)
		TemplateDef = [dim var_Items,hChild]
		TemplateDef = var_Items
		TemplateDef = hChild
		Template = [var_Items.SelectItem(hChild) = True]
	endwith
	hChild = var_Items.InsertItem(h,null,"Task 2")
	var_Items.AddBar(hChild,"Task","08/03/2017","08/10/2017")
	// var_Items.CellState(hChild,0) = 1
	with (oG2antt)
		TemplateDef = [dim var_Items,hChild]
		TemplateDef = var_Items
		TemplateDef = hChild
		Template = [var_Items.CellState(hChild,0) = 1]
	endwith
	hChild = var_Items.InsertItem(h,null,"Task 3")
	var_Items.AddBar(hChild,"Task","08/04/2017","08/12/2017")
	// var_Items.CellState(hChild,0) = 1
	with (oG2antt)
		TemplateDef = [dim var_Items,hChild]
		TemplateDef = var_Items
		TemplateDef = hChild
		Template = [var_Items.CellState(hChild,0) = 1]
	endwith
	var_Items.AddBar(h,"Summary","08/01/2017","08/01/2017","sum")
	var_Items.DefineSummaryBars(h,"sum",-3,"")
	// var_Items.ExpandItem(h) = true
	with (oG2antt)
		TemplateDef = [dim var_Items,h]
		TemplateDef = var_Items
		TemplateDef = h
		Template = [var_Items.ExpandItem(h) = True]
	endwith
	// var_Items.ItemBarEx("itemlevel = 1",257) = true
	with (oG2antt)
		TemplateDef = [dim var_Items]
		TemplateDef = var_Items
		Template = [var_Items.ItemBarEx("itemlevel = 1",257) = True]
	endwith
oG2antt.EndUpdate()
|
|
1921
|
How can I change the caption for all checked Task bars
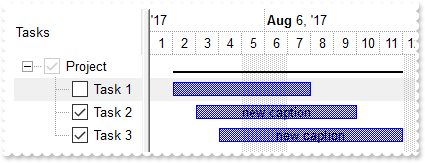
local h,hChild,oG2antt,var_Bar,var_Chart,var_Column,var_Items

oG2antt = form.EXG2ANTTCHARTACTIVEXCONTROL1.nativeObject
oG2antt.BeginUpdate()
oG2antt.LinesAtRoot = -1
var_Column = oG2antt.Columns.Add("Tasks")
	// var_Column.Def(0) = true
	with (oG2antt)
		TemplateDef = [dim var_Column]
		TemplateDef = var_Column
		Template = [var_Column.Def(0) = True]
	endwith
	var_Column.PartialCheck = true
oG2antt.HeaderVisible = 1
oG2antt.SelBackColor = 0xf0f0f0
oG2antt.SelForeColor = 0x0
var_Chart = oG2antt.Chart
	var_Chart.FirstVisibleDate = "08/01/2017"
	var_Chart.LevelCount = 2
	// var_Chart.PaneWidth(false) = 128
	with (oG2antt)
		TemplateDef = [dim var_Chart]
		TemplateDef = var_Chart
		Template = [var_Chart.PaneWidth(False) = 128]
	endwith
	var_Bar = var_Chart.Bars.Item("Summary")
		var_Bar.StartShape = 0
		var_Bar.EndShape = 0
		var_Bar.Shape = 20
	var_Chart.SelBackColor = oG2antt.SelBackColor
	var_Chart.SelBarColor = 0x808080
var_Items = oG2antt.Items
	h = var_Items.AddItem("Project")
	hChild = var_Items.InsertItem(h,null,"Task 1")
	var_Items.AddBar(hChild,"Task","08/02/2017","08/08/2017")
	// var_Items.SelectItem(hChild) = true
	with (oG2antt)
		TemplateDef = [dim var_Items,hChild]
		TemplateDef = var_Items
		TemplateDef = hChild
		Template = [var_Items.SelectItem(hChild) = True]
	endwith
	hChild = var_Items.InsertItem(h,null,"Task 2")
	var_Items.AddBar(hChild,"Task","08/03/2017","08/10/2017")
	// var_Items.CellState(hChild,0) = 1
	with (oG2antt)
		TemplateDef = [dim var_Items,hChild]
		TemplateDef = var_Items
		TemplateDef = hChild
		Template = [var_Items.CellState(hChild,0) = 1]
	endwith
	hChild = var_Items.InsertItem(h,null,"Task 3")
	var_Items.AddBar(hChild,"Task","08/04/2017","08/12/2017")
	// var_Items.CellState(hChild,0) = 1
	with (oG2antt)
		TemplateDef = [dim var_Items,hChild]
		TemplateDef = var_Items
		TemplateDef = hChild
		Template = [var_Items.CellState(hChild,0) = 1]
	endwith
	var_Items.AddBar(h,"Summary","08/01/2017","08/01/2017","sum")
	var_Items.DefineSummaryBars(h,"sum",-3,"")
	// var_Items.ExpandItem(h) = true
	with (oG2antt)
		TemplateDef = [dim var_Items,h]
		TemplateDef = var_Items
		TemplateDef = h
		Template = [var_Items.ExpandItem(h) = True]
	endwith
	// var_Items.ItemBarEx("(cellstate(0) = 1) and (itembar(0) = `Task`)",3) = "`new caption`"
	with (oG2antt)
		TemplateDef = [dim var_Items]
		TemplateDef = var_Items
		Template = [var_Items.ItemBarEx("(cellstate(0) = 1) and (itembar(0) = `Task`)",3) = "`new caption`"]
	endwith
oG2antt.EndUpdate()
|
|
1920
|
How can I change the caption for all Task bars
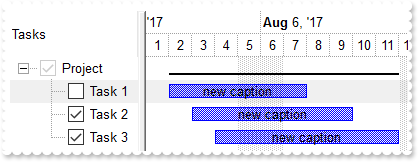
local h,hChild,oG2antt,var_Bar,var_Chart,var_Column,var_Items

oG2antt = form.EXG2ANTTCHARTACTIVEXCONTROL1.nativeObject
oG2antt.BeginUpdate()
oG2antt.LinesAtRoot = -1
var_Column = oG2antt.Columns.Add("Tasks")
	// var_Column.Def(0) = true
	with (oG2antt)
		TemplateDef = [dim var_Column]
		TemplateDef = var_Column
		Template = [var_Column.Def(0) = True]
	endwith
	var_Column.PartialCheck = true
oG2antt.HeaderVisible = 1
oG2antt.SelBackColor = 0xf0f0f0
oG2antt.SelForeColor = 0x0
var_Chart = oG2antt.Chart
	var_Chart.FirstVisibleDate = "08/01/2017"
	var_Chart.LevelCount = 2
	// var_Chart.PaneWidth(false) = 128
	with (oG2antt)
		TemplateDef = [dim var_Chart]
		TemplateDef = var_Chart
		Template = [var_Chart.PaneWidth(False) = 128]
	endwith
	var_Bar = var_Chart.Bars.Item("Summary")
		var_Bar.StartShape = 0
		var_Bar.EndShape = 0
		var_Bar.Shape = 20
	var_Chart.SelBackColor = oG2antt.SelBackColor
	var_Chart.SelBarColor = 0x808080
var_Items = oG2antt.Items
	h = var_Items.AddItem("Project")
	hChild = var_Items.InsertItem(h,null,"Task 1")
	var_Items.AddBar(hChild,"Task","08/02/2017","08/08/2017")
	// var_Items.SelectItem(hChild) = true
	with (oG2antt)
		TemplateDef = [dim var_Items,hChild]
		TemplateDef = var_Items
		TemplateDef = hChild
		Template = [var_Items.SelectItem(hChild) = True]
	endwith
	hChild = var_Items.InsertItem(h,null,"Task 2")
	var_Items.AddBar(hChild,"Task","08/03/2017","08/10/2017")
	// var_Items.CellState(hChild,0) = 1
	with (oG2antt)
		TemplateDef = [dim var_Items,hChild]
		TemplateDef = var_Items
		TemplateDef = hChild
		Template = [var_Items.CellState(hChild,0) = 1]
	endwith
	hChild = var_Items.InsertItem(h,null,"Task 3")
	var_Items.AddBar(hChild,"Task","08/04/2017","08/12/2017")
	// var_Items.CellState(hChild,0) = 1
	with (oG2antt)
		TemplateDef = [dim var_Items,hChild]
		TemplateDef = var_Items
		TemplateDef = hChild
		Template = [var_Items.CellState(hChild,0) = 1]
	endwith
	var_Items.AddBar(h,"Summary","08/01/2017","08/01/2017","sum")
	var_Items.DefineSummaryBars(h,"sum",-3,"")
	// var_Items.ExpandItem(h) = true
	with (oG2antt)
		TemplateDef = [dim var_Items,h]
		TemplateDef = var_Items
		TemplateDef = h
		Template = [var_Items.ExpandItem(h) = True]
	endwith
	// var_Items.ItemBarEx("(itembar(0) = `Task`)",3) = "`new caption`"
	with (oG2antt)
		TemplateDef = [dim var_Items]
		TemplateDef = var_Items
		Template = [var_Items.ItemBarEx("(itembar(0) = `Task`)",3) = "`new caption`"]
	endwith
oG2antt.EndUpdate()
|
|
1919
|
How can I change the caption for all bars
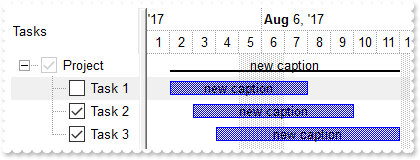
local h,hChild,oG2antt,var_Bar,var_Chart,var_Column,var_Items

oG2antt = form.EXG2ANTTCHARTACTIVEXCONTROL1.nativeObject
oG2antt.BeginUpdate()
oG2antt.LinesAtRoot = -1
var_Column = oG2antt.Columns.Add("Tasks")
	// var_Column.Def(0) = true
	with (oG2antt)
		TemplateDef = [dim var_Column]
		TemplateDef = var_Column
		Template = [var_Column.Def(0) = True]
	endwith
	var_Column.PartialCheck = true
oG2antt.HeaderVisible = 1
oG2antt.SelBackColor = 0xf0f0f0
oG2antt.SelForeColor = 0x0
var_Chart = oG2antt.Chart
	var_Chart.FirstVisibleDate = "08/01/2017"
	var_Chart.LevelCount = 2
	// var_Chart.PaneWidth(false) = 128
	with (oG2antt)
		TemplateDef = [dim var_Chart]
		TemplateDef = var_Chart
		Template = [var_Chart.PaneWidth(False) = 128]
	endwith
	var_Bar = var_Chart.Bars.Item("Summary")
		var_Bar.StartShape = 0
		var_Bar.EndShape = 0
		var_Bar.Shape = 20
	var_Chart.SelBackColor = oG2antt.SelBackColor
	var_Chart.SelBarColor = 0x808080
var_Items = oG2antt.Items
	h = var_Items.AddItem("Project")
	hChild = var_Items.InsertItem(h,null,"Task 1")
	var_Items.AddBar(hChild,"Task","08/02/2017","08/08/2017")
	// var_Items.SelectItem(hChild) = true
	with (oG2antt)
		TemplateDef = [dim var_Items,hChild]
		TemplateDef = var_Items
		TemplateDef = hChild
		Template = [var_Items.SelectItem(hChild) = True]
	endwith
	hChild = var_Items.InsertItem(h,null,"Task 2")
	var_Items.AddBar(hChild,"Task","08/03/2017","08/10/2017")
	// var_Items.CellState(hChild,0) = 1
	with (oG2antt)
		TemplateDef = [dim var_Items,hChild]
		TemplateDef = var_Items
		TemplateDef = hChild
		Template = [var_Items.CellState(hChild,0) = 1]
	endwith
	hChild = var_Items.InsertItem(h,null,"Task 3")
	var_Items.AddBar(hChild,"Task","08/04/2017","08/12/2017")
	// var_Items.CellState(hChild,0) = 1
	with (oG2antt)
		TemplateDef = [dim var_Items,hChild]
		TemplateDef = var_Items
		TemplateDef = hChild
		Template = [var_Items.CellState(hChild,0) = 1]
	endwith
	var_Items.AddBar(h,"Summary","08/01/2017","08/01/2017","sum")
	var_Items.DefineSummaryBars(h,"sum",-3,"")
	// var_Items.ExpandItem(h) = true
	with (oG2antt)
		TemplateDef = [dim var_Items,h]
		TemplateDef = var_Items
		TemplateDef = h
		Template = [var_Items.ExpandItem(h) = True]
	endwith
	// var_Items.ItemBarEx(true,3) = "`new caption`"
	with (oG2antt)
		TemplateDef = [dim var_Items]
		TemplateDef = var_Items
		Template = [var_Items.ItemBarEx(True,3) = "`new caption`"]
	endwith
oG2antt.EndUpdate()
|
|
1918
|
How can I move all Task bars to end at the same date time
local h,hChild,oG2antt,var_Bar,var_Chart,var_Column,var_Items

oG2antt = form.EXG2ANTTCHARTACTIVEXCONTROL1.nativeObject
oG2antt.BeginUpdate()
oG2antt.LinesAtRoot = -1
var_Column = oG2antt.Columns.Add("Tasks")
	// var_Column.Def(0) = true
	with (oG2antt)
		TemplateDef = [dim var_Column]
		TemplateDef = var_Column
		Template = [var_Column.Def(0) = True]
	endwith
	var_Column.PartialCheck = true
oG2antt.HeaderVisible = 1
oG2antt.SelBackColor = 0xf0f0f0
oG2antt.SelForeColor = 0x0
var_Chart = oG2antt.Chart
	var_Chart.FirstVisibleDate = "08/01/2017"
	var_Chart.LevelCount = 2
	// var_Chart.PaneWidth(false) = 128
	with (oG2antt)
		TemplateDef = [dim var_Chart]
		TemplateDef = var_Chart
		Template = [var_Chart.PaneWidth(False) = 128]
	endwith
	var_Bar = var_Chart.Bars.Item("Summary")
		var_Bar.StartShape = 0
		var_Bar.EndShape = 0
		var_Bar.Shape = 20
	var_Chart.SelBackColor = oG2antt.SelBackColor
	var_Chart.SelBarColor = 0x808080
var_Items = oG2antt.Items
	h = var_Items.AddItem("Project")
	hChild = var_Items.InsertItem(h,null,"Task 1")
	var_Items.AddBar(hChild,"Task","08/02/2017","08/08/2017")
	// var_Items.SelectItem(hChild) = true
	with (oG2antt)
		TemplateDef = [dim var_Items,hChild]
		TemplateDef = var_Items
		TemplateDef = hChild
		Template = [var_Items.SelectItem(hChild) = True]
	endwith
	hChild = var_Items.InsertItem(h,null,"Task 2")
	var_Items.AddBar(hChild,"Task","08/03/2017","08/10/2017")
	// var_Items.CellState(hChild,0) = 1
	with (oG2antt)
		TemplateDef = [dim var_Items,hChild]
		TemplateDef = var_Items
		TemplateDef = hChild
		Template = [var_Items.CellState(hChild,0) = 1]
	endwith
	hChild = var_Items.InsertItem(h,null,"Task 3")
	var_Items.AddBar(hChild,"Task","08/04/2017","08/12/2017")
	// var_Items.CellState(hChild,0) = 1
	with (oG2antt)
		TemplateDef = [dim var_Items,hChild]
		TemplateDef = var_Items
		TemplateDef = hChild
		Template = [var_Items.CellState(hChild,0) = 1]
	endwith
	var_Items.AddBar(h,"Summary","08/01/2017","08/01/2017","sum")
	var_Items.DefineSummaryBars(h,"sum",-3,"")
	// var_Items.ExpandItem(h) = true
	with (oG2antt)
		TemplateDef = [dim var_Items,h]
		TemplateDef = var_Items
		TemplateDef = h
		Template = [var_Items.ExpandItem(h) = True]
	endwith
	// var_Items.ItemBarEx("(itembar(0) = `Task`)",514) = "#8/14/2017# - itembar(2)"
	with (oG2antt)
		TemplateDef = [dim var_Items]
		TemplateDef = var_Items
		Template = [var_Items.ItemBarEx("(itembar(0) = `Task`)",514) = "#8/14/2017# - itembar(2)"]
	endwith
oG2antt.EndUpdate()
|
|
1917
|
How can I move all Task bars to start at the same date time
local h,hChild,oG2antt,var_Bar,var_Chart,var_Column,var_Items

oG2antt = form.EXG2ANTTCHARTACTIVEXCONTROL1.nativeObject
oG2antt.BeginUpdate()
oG2antt.LinesAtRoot = -1
var_Column = oG2antt.Columns.Add("Tasks")
	// var_Column.Def(0) = true
	with (oG2antt)
		TemplateDef = [dim var_Column]
		TemplateDef = var_Column
		Template = [var_Column.Def(0) = True]
	endwith
	var_Column.PartialCheck = true
oG2antt.HeaderVisible = 1
oG2antt.SelBackColor = 0xf0f0f0
oG2antt.SelForeColor = 0x0
var_Chart = oG2antt.Chart
	var_Chart.FirstVisibleDate = "08/01/2017"
	var_Chart.LevelCount = 2
	// var_Chart.PaneWidth(false) = 128
	with (oG2antt)
		TemplateDef = [dim var_Chart]
		TemplateDef = var_Chart
		Template = [var_Chart.PaneWidth(False) = 128]
	endwith
	var_Bar = var_Chart.Bars.Item("Summary")
		var_Bar.StartShape = 0
		var_Bar.EndShape = 0
		var_Bar.Shape = 20
	var_Chart.SelBackColor = oG2antt.SelBackColor
	var_Chart.SelBarColor = 0x808080
var_Items = oG2antt.Items
	h = var_Items.AddItem("Project")
	hChild = var_Items.InsertItem(h,null,"Task 1")
	var_Items.AddBar(hChild,"Task","08/02/2017","08/08/2017")
	// var_Items.SelectItem(hChild) = true
	with (oG2antt)
		TemplateDef = [dim var_Items,hChild]
		TemplateDef = var_Items
		TemplateDef = hChild
		Template = [var_Items.SelectItem(hChild) = True]
	endwith
	hChild = var_Items.InsertItem(h,null,"Task 2")
	var_Items.AddBar(hChild,"Task","08/03/2017","08/10/2017")
	// var_Items.CellState(hChild,0) = 1
	with (oG2antt)
		TemplateDef = [dim var_Items,hChild]
		TemplateDef = var_Items
		TemplateDef = hChild
		Template = [var_Items.CellState(hChild,0) = 1]
	endwith
	hChild = var_Items.InsertItem(h,null,"Task 3")
	var_Items.AddBar(hChild,"Task","08/04/2017","08/12/2017")
	// var_Items.CellState(hChild,0) = 1
	with (oG2antt)
		TemplateDef = [dim var_Items,hChild]
		TemplateDef = var_Items
		TemplateDef = hChild
		Template = [var_Items.CellState(hChild,0) = 1]
	endwith
	var_Items.AddBar(h,"Summary","08/01/2017","08/01/2017","sum")
	var_Items.DefineSummaryBars(h,"sum",-3,"")
	// var_Items.ExpandItem(h) = true
	with (oG2antt)
		TemplateDef = [dim var_Items,h]
		TemplateDef = var_Items
		TemplateDef = h
		Template = [var_Items.ExpandItem(h) = True]
	endwith
	// var_Items.ItemBarEx("(itembar(0) = `Task`)",514) = "#8/3/2017# - itembar(1)"
	with (oG2antt)
		TemplateDef = [dim var_Items]
		TemplateDef = var_Items
		Template = [var_Items.ItemBarEx("(itembar(0) = `Task`)",514) = "#8/3/2017# - itembar(1)"]
	endwith
oG2antt.EndUpdate()
|
|
1916
|
How can I change the color for checked Task bars
local h,hChild,oG2antt,var_Bar,var_Chart,var_Column,var_Items

oG2antt = form.EXG2ANTTCHARTACTIVEXCONTROL1.nativeObject
oG2antt.BeginUpdate()
oG2antt.LinesAtRoot = -1
var_Column = oG2antt.Columns.Add("Tasks")
	// var_Column.Def(0) = true
	with (oG2antt)
		TemplateDef = [dim var_Column]
		TemplateDef = var_Column
		Template = [var_Column.Def(0) = True]
	endwith
	var_Column.PartialCheck = true
oG2antt.HeaderVisible = 1
oG2antt.SelBackColor = 0xf0f0f0
oG2antt.SelForeColor = 0x0
var_Chart = oG2antt.Chart
	var_Chart.FirstVisibleDate = "08/01/2017"
	var_Chart.LevelCount = 2
	// var_Chart.PaneWidth(false) = 128
	with (oG2antt)
		TemplateDef = [dim var_Chart]
		TemplateDef = var_Chart
		Template = [var_Chart.PaneWidth(False) = 128]
	endwith
	var_Bar = var_Chart.Bars.Item("Summary")
		var_Bar.StartShape = 0
		var_Bar.EndShape = 0
		var_Bar.Shape = 20
	var_Chart.SelBackColor = oG2antt.SelBackColor
	var_Chart.SelBarColor = 0x808080
var_Items = oG2antt.Items
	h = var_Items.AddItem("Project")
	hChild = var_Items.InsertItem(h,null,"Task 1")
	var_Items.AddBar(hChild,"Task","08/02/2017","08/08/2017")
	// var_Items.SelectItem(hChild) = true
	with (oG2antt)
		TemplateDef = [dim var_Items,hChild]
		TemplateDef = var_Items
		TemplateDef = hChild
		Template = [var_Items.SelectItem(hChild) = True]
	endwith
	hChild = var_Items.InsertItem(h,null,"Task 2")
	var_Items.AddBar(hChild,"Task","08/03/2017","08/10/2017")
	// var_Items.CellState(hChild,0) = 1
	with (oG2antt)
		TemplateDef = [dim var_Items,hChild]
		TemplateDef = var_Items
		TemplateDef = hChild
		Template = [var_Items.CellState(hChild,0) = 1]
	endwith
	hChild = var_Items.InsertItem(h,null,"Task 3")
	var_Items.AddBar(hChild,"Task","08/04/2017","08/12/2017")
	// var_Items.CellState(hChild,0) = 1
	with (oG2antt)
		TemplateDef = [dim var_Items,hChild]
		TemplateDef = var_Items
		TemplateDef = hChild
		Template = [var_Items.CellState(hChild,0) = 1]
	endwith
	var_Items.AddBar(h,"Summary","08/01/2017","08/01/2017","sum")
	var_Items.DefineSummaryBars(h,"sum",-3,"")
	// var_Items.ExpandItem(h) = true
	with (oG2antt)
		TemplateDef = [dim var_Items,h]
		TemplateDef = var_Items
		TemplateDef = h
		Template = [var_Items.ExpandItem(h) = True]
	endwith
	// var_Items.ItemBarEx("cellstate(0) = 1 and itembar(0) = `Task`",33) = 255
	with (oG2antt)
		TemplateDef = [dim var_Items]
		TemplateDef = var_Items
		Template = [var_Items.ItemBarEx("cellstate(0) = 1 and itembar(0) = `Task`",33) = 255]
	endwith
oG2antt.EndUpdate()
|
|
1915
|
How do I resize all Task bars programatically
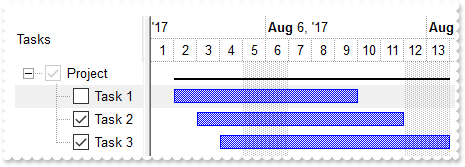
local h,hChild,oG2antt,var_Bar,var_Chart,var_Column,var_Items

oG2antt = form.EXG2ANTTCHARTACTIVEXCONTROL1.nativeObject
oG2antt.BeginUpdate()
oG2antt.LinesAtRoot = -1
var_Column = oG2antt.Columns.Add("Tasks")
	// var_Column.Def(0) = true
	with (oG2antt)
		TemplateDef = [dim var_Column]
		TemplateDef = var_Column
		Template = [var_Column.Def(0) = True]
	endwith
	var_Column.PartialCheck = true
oG2antt.HeaderVisible = 1
oG2antt.SelBackColor = 0xf0f0f0
oG2antt.SelForeColor = 0x0
var_Chart = oG2antt.Chart
	var_Chart.FirstVisibleDate = "08/01/2017"
	var_Chart.LevelCount = 2
	// var_Chart.PaneWidth(false) = 128
	with (oG2antt)
		TemplateDef = [dim var_Chart]
		TemplateDef = var_Chart
		Template = [var_Chart.PaneWidth(False) = 128]
	endwith
	var_Bar = var_Chart.Bars.Item("Summary")
		var_Bar.StartShape = 0
		var_Bar.EndShape = 0
		var_Bar.Shape = 20
	var_Chart.SelBackColor = oG2antt.SelBackColor
	var_Chart.SelBarColor = 0x808080
var_Items = oG2antt.Items
	h = var_Items.AddItem("Project")
	hChild = var_Items.InsertItem(h,null,"Task 1")
	var_Items.AddBar(hChild,"Task","08/02/2017","08/08/2017")
	// var_Items.SelectItem(hChild) = true
	with (oG2antt)
		TemplateDef = [dim var_Items,hChild]
		TemplateDef = var_Items
		TemplateDef = hChild
		Template = [var_Items.SelectItem(hChild) = True]
	endwith
	hChild = var_Items.InsertItem(h,null,"Task 2")
	var_Items.AddBar(hChild,"Task","08/03/2017","08/10/2017")
	// var_Items.CellState(hChild,0) = 1
	with (oG2antt)
		TemplateDef = [dim var_Items,hChild]
		TemplateDef = var_Items
		TemplateDef = hChild
		Template = [var_Items.CellState(hChild,0) = 1]
	endwith
	hChild = var_Items.InsertItem(h,null,"Task 3")
	var_Items.AddBar(hChild,"Task","08/04/2017","08/12/2017")
	// var_Items.CellState(hChild,0) = 1
	with (oG2antt)
		TemplateDef = [dim var_Items,hChild]
		TemplateDef = var_Items
		TemplateDef = hChild
		Template = [var_Items.CellState(hChild,0) = 1]
	endwith
	var_Items.AddBar(h,"Summary","08/01/2017","08/01/2017","sum")
	var_Items.DefineSummaryBars(h,"sum",-3,"")
	// var_Items.ExpandItem(h) = true
	with (oG2antt)
		TemplateDef = [dim var_Items,h]
		TemplateDef = var_Items
		TemplateDef = h
		Template = [var_Items.ExpandItem(h) = True]
	endwith
	// var_Items.ItemBarEx("itembar(0) = `Task`",2) = "value + 2"
	with (oG2antt)
		TemplateDef = [dim var_Items]
		TemplateDef = var_Items
		Template = [var_Items.ItemBarEx("itembar(0) = `Task`",2) = "value + 2"]
	endwith
oG2antt.EndUpdate()
|
|
1914
|
How do I move just the checked Task bars in the chart
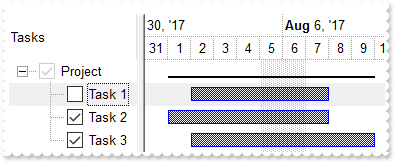
local h,hChild,oG2antt,var_Bar,var_Chart,var_Column,var_Items

oG2antt = form.EXG2ANTTCHARTACTIVEXCONTROL1.nativeObject
oG2antt.BeginUpdate()
oG2antt.LinesAtRoot = -1
var_Column = oG2antt.Columns.Add("Tasks")
	// var_Column.Def(0) = true
	with (oG2antt)
		TemplateDef = [dim var_Column]
		TemplateDef = var_Column
		Template = [var_Column.Def(0) = True]
	endwith
	var_Column.PartialCheck = true
oG2antt.HeaderVisible = 1
oG2antt.SelBackColor = 0xf0f0f0
oG2antt.SelForeColor = 0x0
var_Chart = oG2antt.Chart
	var_Chart.FirstVisibleDate = "08/01/2017"
	var_Chart.LevelCount = 2
	// var_Chart.PaneWidth(false) = 128
	with (oG2antt)
		TemplateDef = [dim var_Chart]
		TemplateDef = var_Chart
		Template = [var_Chart.PaneWidth(False) = 128]
	endwith
	var_Bar = var_Chart.Bars.Item("Summary")
		var_Bar.StartShape = 0
		var_Bar.EndShape = 0
		var_Bar.Shape = 20
	var_Chart.SelBackColor = oG2antt.SelBackColor
	var_Chart.SelBarColor = 0x808080
var_Items = oG2antt.Items
	h = var_Items.AddItem("Project")
	hChild = var_Items.InsertItem(h,null,"Task 1")
	var_Items.AddBar(hChild,"Task","08/02/2017","08/08/2017")
	// var_Items.SelectItem(hChild) = true
	with (oG2antt)
		TemplateDef = [dim var_Items,hChild]
		TemplateDef = var_Items
		TemplateDef = hChild
		Template = [var_Items.SelectItem(hChild) = True]
	endwith
	hChild = var_Items.InsertItem(h,null,"Task 2")
	var_Items.AddBar(hChild,"Task","08/03/2017","08/10/2017")
	// var_Items.CellState(hChild,0) = 1
	with (oG2antt)
		TemplateDef = [dim var_Items,hChild]
		TemplateDef = var_Items
		TemplateDef = hChild
		Template = [var_Items.CellState(hChild,0) = 1]
	endwith
	hChild = var_Items.InsertItem(h,null,"Task 3")
	var_Items.AddBar(hChild,"Task","08/04/2017","08/12/2017")
	// var_Items.CellState(hChild,0) = 1
	with (oG2antt)
		TemplateDef = [dim var_Items,hChild]
		TemplateDef = var_Items
		TemplateDef = hChild
		Template = [var_Items.CellState(hChild,0) = 1]
	endwith
	var_Items.AddBar(h,"Summary","08/01/2017","08/01/2017","sum")
	var_Items.DefineSummaryBars(h,"sum",-3,"")
	// var_Items.ExpandItem(h) = true
	with (oG2antt)
		TemplateDef = [dim var_Items,h]
		TemplateDef = var_Items
		TemplateDef = h
		Template = [var_Items.ExpandItem(h) = True]
	endwith
	// var_Items.ItemBarEx("cellstate(0) = 1 and itembar(0) = `Task`",514) = -2
	with (oG2antt)
		TemplateDef = [dim var_Items]
		TemplateDef = var_Items
		Template = [var_Items.ItemBarEx("cellstate(0) = 1 and itembar(0) = `Task`",514) = -2]
	endwith
oG2antt.EndUpdate()
|
|
1913
|
How do I move all Task bars in the chart
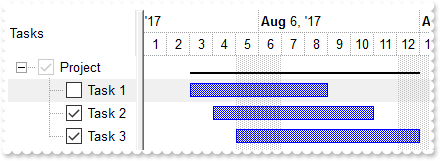
local h,hChild,oG2antt,var_Bar,var_Chart,var_Column,var_Items

oG2antt = form.EXG2ANTTCHARTACTIVEXCONTROL1.nativeObject
oG2antt.BeginUpdate()
oG2antt.LinesAtRoot = -1
var_Column = oG2antt.Columns.Add("Tasks")
	// var_Column.Def(0) = true
	with (oG2antt)
		TemplateDef = [dim var_Column]
		TemplateDef = var_Column
		Template = [var_Column.Def(0) = True]
	endwith
	var_Column.PartialCheck = true
oG2antt.HeaderVisible = 1
oG2antt.SelBackColor = 0xf0f0f0
oG2antt.SelForeColor = 0x0
var_Chart = oG2antt.Chart
	var_Chart.FirstVisibleDate = "08/01/2017"
	var_Chart.LevelCount = 2
	// var_Chart.PaneWidth(false) = 128
	with (oG2antt)
		TemplateDef = [dim var_Chart]
		TemplateDef = var_Chart
		Template = [var_Chart.PaneWidth(False) = 128]
	endwith
	var_Bar = var_Chart.Bars.Item("Summary")
		var_Bar.StartShape = 0
		var_Bar.EndShape = 0
		var_Bar.Shape = 20
	var_Chart.SelBackColor = oG2antt.SelBackColor
	var_Chart.SelBarColor = 0x808080
var_Items = oG2antt.Items
	h = var_Items.AddItem("Project")
	hChild = var_Items.InsertItem(h,null,"Task 1")
	var_Items.AddBar(hChild,"Task","08/02/2017","08/08/2017")
	// var_Items.SelectItem(hChild) = true
	with (oG2antt)
		TemplateDef = [dim var_Items,hChild]
		TemplateDef = var_Items
		TemplateDef = hChild
		Template = [var_Items.SelectItem(hChild) = True]
	endwith
	hChild = var_Items.InsertItem(h,null,"Task 2")
	var_Items.AddBar(hChild,"Task","08/03/2017","08/10/2017")
	// var_Items.CellState(hChild,0) = 1
	with (oG2antt)
		TemplateDef = [dim var_Items,hChild]
		TemplateDef = var_Items
		TemplateDef = hChild
		Template = [var_Items.CellState(hChild,0) = 1]
	endwith
	hChild = var_Items.InsertItem(h,null,"Task 3")
	var_Items.AddBar(hChild,"Task","08/04/2017","08/12/2017")
	// var_Items.CellState(hChild,0) = 1
	with (oG2antt)
		TemplateDef = [dim var_Items,hChild]
		TemplateDef = var_Items
		TemplateDef = hChild
		Template = [var_Items.CellState(hChild,0) = 1]
	endwith
	var_Items.AddBar(h,"Summary","08/01/2017","08/01/2017","sum")
	var_Items.DefineSummaryBars(h,"sum",-3,"")
	// var_Items.ExpandItem(h) = true
	with (oG2antt)
		TemplateDef = [dim var_Items,h]
		TemplateDef = var_Items
		TemplateDef = h
		Template = [var_Items.ExpandItem(h) = True]
	endwith
	// var_Items.ItemBarEx("itembar(0) = `Task`",514) = 1
	with (oG2antt)
		TemplateDef = [dim var_Items]
		TemplateDef = var_Items
		Template = [var_Items.ItemBarEx("itembar(0) = `Task`",514) = 1]
	endwith
oG2antt.EndUpdate()
|
|
1912
|
How do I count all Task bars in the chart
local h,hChild,oG2antt,var_Bar,var_Chart,var_Items

oG2antt = form.EXG2ANTTCHARTACTIVEXCONTROL1.nativeObject
oG2antt.BeginUpdate()
oG2antt.LinesAtRoot = -1
oG2antt.Columns.Add("Tasks")
oG2antt.HeaderVisible = 1
oG2antt.SelBackColor = 0xf0f0f0
oG2antt.SelForeColor = 0x0
var_Chart = oG2antt.Chart
	var_Chart.FirstVisibleDate = "08/01/2017"
	var_Chart.LevelCount = 2
	// var_Chart.PaneWidth(false) = 128
	with (oG2antt)
		TemplateDef = [dim var_Chart]
		TemplateDef = var_Chart
		Template = [var_Chart.PaneWidth(False) = 128]
	endwith
	var_Bar = var_Chart.Bars.Item("Summary")
		var_Bar.StartShape = 0
		var_Bar.EndShape = 0
		var_Bar.Shape = 20
	var_Chart.SelBackColor = oG2antt.SelBackColor
	var_Chart.SelBarColor = 0x808080
var_Items = oG2antt.Items
	h = var_Items.AddItem("Project")
	hChild = var_Items.InsertItem(h,null,"Task 1")
	var_Items.AddBar(hChild,"Task","08/02/2017","08/08/2017")
	hChild = var_Items.InsertItem(h,null,"Task 2")
	var_Items.AddBar(hChild,"Task","08/03/2017","08/10/2017")
	hChild = var_Items.InsertItem(h,null,"Task 3")
	var_Items.AddBar(hChild,"Task","08/04/2017","08/12/2017")
	var_Items.AddBar(h,"Summary","08/01/2017","08/01/2017","sum")
	var_Items.DefineSummaryBars(h,"sum",-3,"")
	// var_Items.ExpandItem(h) = true
	with (oG2antt)
		TemplateDef = [dim var_Items,h]
		TemplateDef = var_Items
		TemplateDef = h
		Template = [var_Items.ExpandItem(h) = True]
	endwith
	? Str(var_Items.ItemBarEx("itembar(0) = `Task`",256))
oG2antt.EndUpdate()
|
|
1911
|
How do I select bars whose items are checked
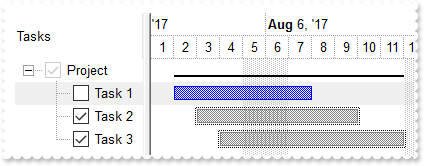
local h,hChild,oG2antt,var_Bar,var_Chart,var_Column,var_Items

oG2antt = form.EXG2ANTTCHARTACTIVEXCONTROL1.nativeObject
oG2antt.BeginUpdate()
oG2antt.LinesAtRoot = -1
var_Column = oG2antt.Columns.Add("Tasks")
	// var_Column.Def(0) = true
	with (oG2antt)
		TemplateDef = [dim var_Column]
		TemplateDef = var_Column
		Template = [var_Column.Def(0) = True]
	endwith
	var_Column.PartialCheck = true
oG2antt.HeaderVisible = 1
oG2antt.SelBackColor = 0xf0f0f0
oG2antt.SelForeColor = 0x0
var_Chart = oG2antt.Chart
	var_Chart.FirstVisibleDate = "08/01/2017"
	var_Chart.LevelCount = 2
	// var_Chart.PaneWidth(false) = 128
	with (oG2antt)
		TemplateDef = [dim var_Chart]
		TemplateDef = var_Chart
		Template = [var_Chart.PaneWidth(False) = 128]
	endwith
	var_Bar = var_Chart.Bars.Item("Summary")
		var_Bar.StartShape = 0
		var_Bar.EndShape = 0
		var_Bar.Shape = 20
	var_Chart.SelBackColor = oG2antt.SelBackColor
	var_Chart.SelBarColor = 0x808080
var_Items = oG2antt.Items
	h = var_Items.AddItem("Project")
	hChild = var_Items.InsertItem(h,null,"Task 1")
	var_Items.AddBar(hChild,"Task","08/02/2017","08/08/2017")
	// var_Items.SelectItem(hChild) = true
	with (oG2antt)
		TemplateDef = [dim var_Items,hChild]
		TemplateDef = var_Items
		TemplateDef = hChild
		Template = [var_Items.SelectItem(hChild) = True]
	endwith
	hChild = var_Items.InsertItem(h,null,"Task 2")
	var_Items.AddBar(hChild,"Task","08/03/2017","08/10/2017")
	// var_Items.CellState(hChild,0) = 1
	with (oG2antt)
		TemplateDef = [dim var_Items,hChild]
		TemplateDef = var_Items
		TemplateDef = hChild
		Template = [var_Items.CellState(hChild,0) = 1]
	endwith
	hChild = var_Items.InsertItem(h,null,"Task 3")
	var_Items.AddBar(hChild,"Task","08/04/2017","08/12/2017")
	// var_Items.CellState(hChild,0) = 1
	with (oG2antt)
		TemplateDef = [dim var_Items,hChild]
		TemplateDef = var_Items
		TemplateDef = hChild
		Template = [var_Items.CellState(hChild,0) = 1]
	endwith
	var_Items.AddBar(h,"Summary","08/01/2017","08/01/2017","sum")
	var_Items.DefineSummaryBars(h,"sum",-3,"")
	// var_Items.ExpandItem(h) = true
	with (oG2antt)
		TemplateDef = [dim var_Items,h]
		TemplateDef = var_Items
		TemplateDef = h
		Template = [var_Items.ExpandItem(h) = True]
	endwith
	// var_Items.ItemBarEx("cellstate(0) = 1",257) = true
	with (oG2antt)
		TemplateDef = [dim var_Items]
		TemplateDef = var_Items
		Template = [var_Items.ItemBarEx("cellstate(0) = 1",257) = True]
	endwith
oG2antt.EndUpdate()
|
|
1910
|
How can I select all bars, where a specified column matches a specified criteria
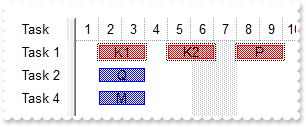
local h,oG2antt,var_Chart,var_Items

oG2antt = form.EXG2ANTTCHARTACTIVEXCONTROL1.nativeObject
oG2antt.BeginUpdate()
oG2antt.Columns.Add("Task")
oG2antt.Chart.FirstVisibleDate = "01/01/2001"
// oG2antt.Chart.PaneWidth(false) = 48
var_Chart = oG2antt.Chart
with (oG2antt)
	TemplateDef = [dim var_Chart]
	TemplateDef = var_Chart
	Template = [var_Chart.PaneWidth(False) = 48]
endwith
oG2antt.Chart.SelBarColor = 0xff
var_Items = oG2antt.Items
	h = var_Items.AddItem("Task 1")
	var_Items.AddBar(h,"Task","01/02/2001","01/04/2001","K1","K1")
	var_Items.AddBar(h,"Task","01/05/2001","01/07/2001","K2","K2")
	var_Items.AddBar(h,"Task","01/08/2001","01/10/2001","P","P")
	var_Items.AddBar(var_Items.AddItem("Task 2"),"Task","01/02/2001","01/04/2001","Q","Q")
	var_Items.AddBar(var_Items.AddItem("Task 4"),"Task","01/02/2001","01/04/2001","M","M")
	// var_Items.ItemBarEx("cellcaption(0) = `Task 1`",257) = true
	with (oG2antt)
		TemplateDef = [dim var_Items]
		TemplateDef = var_Items
		Template = [var_Items.ItemBarEx("cellcaption(0) = `Task 1`",257) = True]
	endwith
oG2antt.EndUpdate()
|
|
1909
|
How can I select/unselect all bars
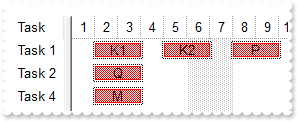
local h,oG2antt,var_Chart,var_Items

oG2antt = form.EXG2ANTTCHARTACTIVEXCONTROL1.nativeObject
oG2antt.BeginUpdate()
oG2antt.Columns.Add("Task")
oG2antt.Chart.FirstVisibleDate = "01/01/2001"
// oG2antt.Chart.PaneWidth(false) = 48
var_Chart = oG2antt.Chart
with (oG2antt)
	TemplateDef = [dim var_Chart]
	TemplateDef = var_Chart
	Template = [var_Chart.PaneWidth(False) = 48]
endwith
oG2antt.Chart.SelBarColor = 0xff
var_Items = oG2antt.Items
	h = var_Items.AddItem("Task 1")
	var_Items.AddBar(h,"Task","01/02/2001","01/04/2001","K1","K1")
	var_Items.AddBar(h,"Task","01/05/2001","01/07/2001","K2","K2")
	var_Items.AddBar(h,"Task","01/08/2001","01/10/2001","P","P")
	var_Items.AddBar(var_Items.AddItem("Task 2"),"Task","01/02/2001","01/04/2001","Q","Q")
	var_Items.AddBar(var_Items.AddItem("Task 4"),"Task","01/02/2001","01/04/2001","M","M")
	// var_Items.ItemBarEx(true,257) = true
	with (oG2antt)
		TemplateDef = [dim var_Items]
		TemplateDef = var_Items
		Template = [var_Items.ItemBarEx(True,257) = True]
	endwith
oG2antt.EndUpdate()
|
|
1908
|
Is it possible to set the background color of the chart for one item and one day
local h,oG2antt,var_Chart,var_Items

oG2antt = form.EXG2ANTTCHARTACTIVEXCONTROL1.nativeObject
oG2antt.BeginUpdate()
oG2antt.Columns.Add("Items")
var_Chart = oG2antt.Chart
	var_Chart.LevelCount = 2
	// var_Chart.PaneWidth(false) = 96
	with (oG2antt)
		TemplateDef = [dim var_Chart]
		TemplateDef = var_Chart
		Template = [var_Chart.PaneWidth(False) = 96]
	endwith
	var_Chart.FirstVisibleDate = "01/01/2001"
var_Items = oG2antt.Items
	var_Items.AddItem("Item")
	h = var_Items.AddItem("Item")
	var_Items.AddBar(h,"","01/02/2001","01/03/2001","Back"," ")
	// var_Items.ItemBar(h,"Back",7) = 255
	with (oG2antt)
		TemplateDef = [dim var_Items,h]
		TemplateDef = var_Items
		TemplateDef = h
		Template = [var_Items.ItemBar(h,"Back",7) = 255]
	endwith
	// var_Items.ItemBar(h,"Back",29) = false
	with (oG2antt)
		TemplateDef = [dim var_Items,h]
		TemplateDef = var_Items
		TemplateDef = h
		Template = [var_Items.ItemBar(h,"Back",29) = False]
	endwith
	var_Items.AddItem("Item")
oG2antt.EndUpdate()
|
|
1907
|
It is possible to search for an item ( inside the Editor ), case insensitive
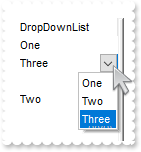
local oG2antt,var_Editor,var_Items

oG2antt = form.EXG2ANTTCHARTACTIVEXCONTROL1.nativeObject
oG2antt.BeginUpdate()
var_Editor = oG2antt.Columns.Add("DropDownList").Editor
	var_Editor.EditType = 3
	var_Editor.AddItem(1,"One")
	var_Editor.AddItem(2,"Two")
	var_Editor.AddItem(3,"Three")
var_Items = oG2antt.Items
	var_Items.AddItem(oG2antt.Columns.Item(0).Editor.FindItem(">ONE"))
	var_Items.AddItem(oG2antt.Columns.Item(0).Editor.FindItem(">ThRee"))
	var_Items.AddItem(oG2antt.Columns.Item(0).Editor.FindItem("ONE"))
	var_Items.AddItem(oG2antt.Columns.Item(0).Editor.FindItem(">tWo"))
oG2antt.EndUpdate()
|
|
1906
|
The text after the BR-tag is in same line as the text before the BR-tag (entire column)
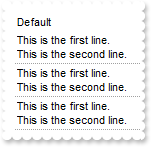
local oG2antt,var_Chart,var_Column,var_Items

oG2antt = form.EXG2ANTTCHARTACTIVEXCONTROL1.nativeObject
oG2antt.BeginUpdate()
oG2antt.DrawGridLines = 1
// oG2antt.Chart.PaneWidth(true) = 0
var_Chart = oG2antt.Chart
with (oG2antt)
	TemplateDef = [dim var_Chart]
	TemplateDef = var_Chart
	Template = [var_Chart.PaneWidth(True) = 0]
endwith
var_Column = oG2antt.Columns.Add("Default")
	// var_Column.Def(17) = 1
	with (oG2antt)
		TemplateDef = [dim var_Column]
		TemplateDef = var_Column
		Template = [var_Column.Def(17) = 1]
	endwith
	// var_Column.Def(16) = false
	with (oG2antt)
		TemplateDef = [dim var_Column]
		TemplateDef = var_Column
		Template = [var_Column.Def(16) = False]
	endwith
var_Items = oG2antt.Items
	var_Items.AddItem("This is the first line.<br>This is the second line.")
	var_Items.AddItem("This is the first line.<br>This is the second line.")
	var_Items.AddItem("This is the first line.<br>This is the second line.")
oG2antt.EndUpdate()
|
|
1905
|
The text after the BR-tag is in same line as the text before the BR-tag (individual)
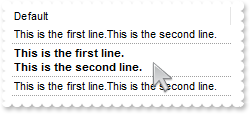
local h,oG2antt,var_Chart,var_Items

oG2antt = form.EXG2ANTTCHARTACTIVEXCONTROL1.nativeObject
oG2antt.BeginUpdate()
oG2antt.DrawGridLines = 1
// oG2antt.Chart.PaneWidth(true) = 0
var_Chart = oG2antt.Chart
with (oG2antt)
	TemplateDef = [dim var_Chart]
	TemplateDef = var_Chart
	Template = [var_Chart.PaneWidth(True) = 0]
endwith
oG2antt.Columns.Add("Default")
var_Items = oG2antt.Items
	// var_Items.CellValueFormat(var_Items.AddItem("This is the first line.<br>This is the second line."),0) = 1
	with (oG2antt)
		TemplateDef = [dim var_Items]
		TemplateDef = var_Items
		Template = [var_Items.CellValueFormat(AddItem("This is the first line.<br>This is the second line."),0) = 1]
	endwith
	h = var_Items.AddItem("<b>This is the first line.<br>This is the second line.</b>")
	// var_Items.CellValueFormat(h,0) = 1
	with (oG2antt)
		TemplateDef = [dim var_Items,h]
		TemplateDef = var_Items
		TemplateDef = h
		Template = [var_Items.CellValueFormat(h,0) = 1]
	endwith
	// var_Items.CellSingleLine(h,0) = false
	with (oG2antt)
		TemplateDef = [dim var_Items,h]
		TemplateDef = var_Items
		TemplateDef = h
		Template = [var_Items.CellSingleLine(h,0) = False]
	endwith
	// var_Items.CellValueFormat(var_Items.AddItem("This is the first line.<br>This is the second line."),0) = 1
	with (oG2antt)
		TemplateDef = [dim var_Items]
		TemplateDef = var_Items
		Template = [var_Items.CellValueFormat(AddItem("This is the first line.<br>This is the second line."),0) = 1]
	endwith
oG2antt.EndUpdate()
|
|
1904
|
How do I prevent showing the control's BackColorAlternate property on empty / non-items part of the control
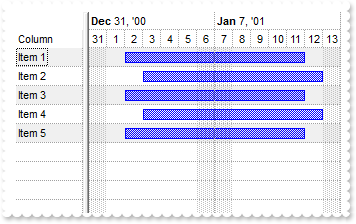
local oG2antt,var_Chart,var_Items

oG2antt = form.EXG2ANTTCHARTACTIVEXCONTROL1.nativeObject
oG2antt.BeginUpdate()
oG2antt.DrawGridLines = -1
var_Chart = oG2antt.Chart
	var_Chart.DrawGridLines = -1
	var_Chart.LevelCount = 2
	// var_Chart.PaneWidth(false) = 128
	with (oG2antt)
		TemplateDef = [dim var_Chart]
		TemplateDef = var_Chart
		Template = [var_Chart.PaneWidth(False) = 128]
	endwith
	var_Chart.FirstVisibleDate = "01/01/2001"
oG2antt.BackColorAlternate = 0x7ff0f0f0
oG2antt.BackColorLevelHeader = oG2antt.BackColor
oG2antt.Columns.Add("Column")
var_Items = oG2antt.Items
	var_Items.AddBar(var_Items.AddItem("Item 1"),"Task","01/02/2001","01/12/2001")
	var_Items.AddBar(var_Items.AddItem("Item 2"),"Task","01/03/2001","01/13/2001")
	var_Items.AddBar(var_Items.AddItem("Item 3"),"Task","01/02/2001","01/12/2001")
	var_Items.AddBar(var_Items.AddItem("Item 4"),"Task","01/03/2001","01/13/2001")
	var_Items.AddBar(var_Items.AddItem("Item 5"),"Task","01/02/2001","01/12/2001")
oG2antt.EndUpdate()
|
|
1903
|
Can I disable an item once the user selects a new value into a different item
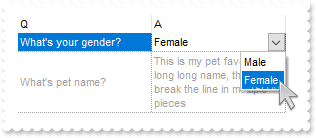
/*
with (this.EXG2ANTTCHARTACTIVEXCONTROL1.nativeObject)
	Change = class::nativeObject_Change
endwith
*/
// Occurs when the user changes the cell's content.
function nativeObject_Change(Item, ColIndex, NewValue)
	local var_Items
	oG2antt = form.EXG2ANTTCHARTACTIVEXCONTROL1.nativeObject
	var_Items = oG2antt.Items
		// var_Items.EnableItem(var_Items.ItemByIndex(1)) = false
		with (oG2antt)
			TemplateDef = [dim var_Items]
			TemplateDef = var_Items
			Template = [var_Items.EnableItem(ItemByIndex(1)) = NewValue]
		endwith
return

local h1,h2,oG2antt,var_Chart,var_Editor,var_Items

oG2antt = form.EXG2ANTTCHARTACTIVEXCONTROL1.nativeObject
oG2antt.FreezeEvents(true)
oG2antt.BeginUpdate()
// oG2antt.Chart.PaneWidth(true) = 0
var_Chart = oG2antt.Chart
with (oG2antt)
	TemplateDef = [dim var_Chart]
	TemplateDef = var_Chart
	Template = [var_Chart.PaneWidth(True) = 0]
endwith
oG2antt.ScrollBySingleLine = true
oG2antt.DrawGridLines = -2
oG2antt.Columns.Add("Q")
oG2antt.Columns.Add("A")
var_Items = oG2antt.Items
	h1 = var_Items.AddItem("What's your gender?")
	var_Editor = var_Items.CellEditor(h1,1)
		var_Editor.EditType = 3
		var_Editor.AddItem(1,"Male")
		var_Editor.AddItem(0,"Female")
	// var_Items.CellValue(h1,1) = 1
	with (oG2antt)
		TemplateDef = [dim var_Items,h1]
		TemplateDef = var_Items
		TemplateDef = h1
		Template = [var_Items.CellValue(h1,1) = 1]
	endwith
	h2 = var_Items.AddItem("What's pet name?")
	// var_Items.CellValue(h2,1) = "This is my pet favorite long long long name, that shoul break the line in multiple pieces"
	with (oG2antt)
		TemplateDef = [dim var_Items,h2]
		TemplateDef = var_Items
		TemplateDef = h2
		Template = [var_Items.CellValue(h2,1) = "This is my pet favorite long long long name, that shoul break the line in multiple pieces"]
	endwith
	// var_Items.CellSingleLine(h2,1) = false
	with (oG2antt)
		TemplateDef = [dim var_Items,h2]
		TemplateDef = var_Items
		TemplateDef = h2
		Template = [var_Items.CellSingleLine(h2,1) = False]
	endwith
oG2antt.EndUpdate()
oG2antt.FreezeEvents(false)
|
|
1902
|
How can I get a row expanded / enlarged to fit the cell's text (entire column)
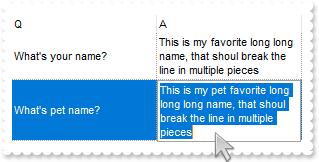
local h1,h2,oG2antt,var_Chart,var_Column,var_Editor,var_Items

oG2antt = form.EXG2ANTTCHARTACTIVEXCONTROL1.nativeObject
oG2antt.BeginUpdate()
// oG2antt.Chart.PaneWidth(true) = 0
var_Chart = oG2antt.Chart
with (oG2antt)
	TemplateDef = [dim var_Chart]
	TemplateDef = var_Chart
	Template = [var_Chart.PaneWidth(True) = 0]
endwith
oG2antt.ScrollBySingleLine = true
oG2antt.DrawGridLines = -2
oG2antt.Columns.Add("Q")
var_Column = oG2antt.Columns.Add("A")
	// var_Column.Def(16) = false
	with (oG2antt)
		TemplateDef = [dim var_Column]
		TemplateDef = var_Column
		Template = [var_Column.Def(16) = False]
	endwith
	var_Editor = var_Column.Editor
		var_Editor.EditType = 5
		var_Editor.Appearance = 8
var_Items = oG2antt.Items
	h1 = var_Items.AddItem("What's name?")
	// var_Items.CellValue(h1,1) = "This is my pet favorite long long long name, that shoul break the line in multiple pieces"
	with (oG2antt)
		TemplateDef = [dim var_Items,h1]
		TemplateDef = var_Items
		TemplateDef = h1
		Template = [var_Items.CellValue(h1,1) = "This is my pet favorite long long long name, that shoul break the line in multiple pieces"]
	endwith
	h2 = var_Items.AddItem("What's your pet name?")
	// var_Items.CellValue(h2,1) = "This is my pet favorite long long long name, that shoul break the line in multiple pieces"
	with (oG2antt)
		TemplateDef = [dim var_Items,h2]
		TemplateDef = var_Items
		TemplateDef = h2
		Template = [var_Items.CellValue(h2,1) = "This is my pet favorite long long long name, that shoul break the line in multiple pieces"]
	endwith
oG2antt.EndUpdate()
|
|
1901
|
How can I get a row expanded / enlarged to fit the cell's text (individual cell)
local h1,h2,oG2antt,var_Chart,var_Editor,var_Items

oG2antt = form.EXG2ANTTCHARTACTIVEXCONTROL1.nativeObject
oG2antt.BeginUpdate()
// oG2antt.Chart.PaneWidth(true) = 0
var_Chart = oG2antt.Chart
with (oG2antt)
	TemplateDef = [dim var_Chart]
	TemplateDef = var_Chart
	Template = [var_Chart.PaneWidth(True) = 0]
endwith
oG2antt.ScrollBySingleLine = true
oG2antt.DrawGridLines = -2
oG2antt.Columns.Add("Q")
oG2antt.Columns.Add("A")
var_Items = oG2antt.Items
	h1 = var_Items.AddItem("What's name?")
	// var_Items.CellValue(h1,1) = "This is my pet favorite long long long name, that shoul break the line in multiple pieces"
	with (oG2antt)
		TemplateDef = [dim var_Items,h1]
		TemplateDef = var_Items
		TemplateDef = h1
		Template = [var_Items.CellValue(h1,1) = "This is my pet favorite long long long name, that shoul break the line in multiple pieces"]
	endwith
	h2 = var_Items.AddItem("What's your pet name?")
	var_Editor = var_Items.CellEditor(h2,1)
		var_Editor.EditType = 5
		var_Editor.Appearance = 8
	// var_Items.CellValue(h2,1) = "This is my pet favorite long long long name, that shoul break the line in multiple pieces"
	with (oG2antt)
		TemplateDef = [dim var_Items,h2]
		TemplateDef = var_Items
		TemplateDef = h2
		Template = [var_Items.CellValue(h2,1) = "This is my pet favorite long long long name, that shoul break the line in multiple pieces"]
	endwith
	// var_Items.CellSingleLine(h2,1) = false
	with (oG2antt)
		TemplateDef = [dim var_Items,h2]
		TemplateDef = var_Items
		TemplateDef = h2
		Template = [var_Items.CellSingleLine(h2,1) = False]
	endwith
oG2antt.EndUpdate()
|